Author

admin

Browsing

Nokia’s 30% collapse in July looked like the market calling time on a hype cycle. It was not. Read the quarter and the opposite happened: AI & Cloud order intake nearly tripled to €2.8bn, Optical Networks grew 20% and IP Networks 16%. Demand accelerated. What broke the stock was a cost line — Ericsson warned that memory-chip inflation would compress equipment margins into 2027, and the entire sector de-rated in sympathy. That is the single most useful thing to understand about Nokia (NYSE: NOK) at $10.76. Its bull case and its bear case are the same event seen from opposite ends. The AI memory shortage that turned Micron into an 8.4x winner is the shortage now raising Nokia’s input costs. Nokia is short exactly what Micron is long. The street prices that tension between $8.50 and $21.00, and where you land depends entirely on which side of the shortage you think dominates.

The insight: one shortage, two directions

The mechanism is worth spelling out because almost nobody connects the two halves. Three manufacturers — SK hynix, Samsung and Micron — control more than 95% of global DRAM production. From 2025 they began systematically reallocating wafer capacity toward high-bandwidth memory to serve AI accelerators, and by mid-2026 HBM was consuming roughly 25% of total DRAM wafer output. That capacity used to supply conventional DRAM to everyone else, and “everyone else” includes the people who build mobile base stations.

So the AI boom reaches Nokia twice. It arrives as revenue, through optical and IP networking gear sold into data centres, and it arrives as cost, through the conventional DRAM in every radio unit Nokia ships. The second effect is nastier than it sounds because of contract structure: Ericsson noted that most telecom equipment contracts are long-term and lack automatic price-pass-through clauses, so a vendor facing a component spike cannot simply reprice. It has to absorb the hit or renegotiate. Ericsson guided Q3 Networks adjusted gross margin down to 48–50% and described the inflation as building “gradually” through the second half of 2026 and into 2027.

Set that against the other side of the trade. Our Micron bull and bear case and the CXMT listing that rattled Micron and SK Hynix describe the same scarcity from the seller’s chair, where it shows up as record margins. Nokia sits in the buyer’s chair. Any forecast for NOK is therefore a forecast about which moves faster: AI-driven revenue arriving, or AI-driven input costs arriving.

Key facts

  • NOK last close $10.76, up 1.89%; 52-week closing range $4.13 to $16.85 — 14 August 2026 (StockAnalysis)
  • Street targets: consensus $15.02, high $21.00, low $8.50 across 11 analysts, consensus rating Buy (StockAnalysis)
  • Q2 2026 net sales €4.82bn, up 8%; comparable operating profit €434m, up 18%; comparable operating margin 9% versus 8.3% — Nokia, 23 July 2026
  • AI & Cloud order intake €2.8bn in Q2, up from roughly €1.0bn in Q1
  • Optical Networks +20%, IP Networks +16%, while Fixed Networks fell 2%
  • Nvidia invested $1bn for a 2.9% stake and a joint AI-RAN platform for 6G
  • HBM consumes ~25% of DRAM wafer output by mid-2026, squeezing the conventional DRAM that base stations need — Ericsson, July 2026

What actually happened: a quadruple and a giveback

Nokia closed at $4.13 in August 2025, a price that valued it as a structurally declining telecom equipment vendor with a licensing business attached. Ten months later it closed at $16.85 on 2 June 2026, having roughly quadrupled. The catalyst was a genuine change of identity rather than a sentiment swing. Under Justin Hotard, who arrived from Intel’s data centre and AI group in 2025, Nokia repositioned from selling radios to telcos toward selling optical and IP networking into AI data centres.

Nvidia then validated it with money. In October 2025 Nvidia took a $1bn equity stake, becoming a 2.9% shareholder, alongside a partnership to build an AI-RAN platform for 6G and to explore incorporating Nokia’s data centre switching and optical technology into Nvidia’s future architectures. “The next leap in telecom isn’t just from 5G to 6G – it’s a fundamental redesign of the network to deliver AI-powered connectivity, capable of processing intelligence from the data center all the way to the edge,” said Justin Hotard, President and CEO of Nokia. “Our partnership with Nvidia will accelerate AI-RAN innovation to put an AI data center into everyone’s pocket.”

Then July happened. Ericsson reported a weak quarter and flagged component inflation, the broad technology tape sold off, and a stock that had quadrupled met concentrated profit-taking. Nokia fell roughly 30% over the month, bottoming near $9.83 before recovering to $10.76. Crucially, none of that was Nokia-specific news about demand. The Q2 report that landed on 23 July was, on its own terms, good.

The bull case: the order book is not a legacy order book

Nokia’s Q2 produced €4.82bn of net sales, up 8%, with comparable operating profit of €434m, up 18%, lifting the comparable operating margin to 9% from 8.3% and the comparable gross margin to 46% from 45.3%. Comparable EPS came in at €0.07 against €0.04 a year earlier. Those are respectable numbers for a company long assumed to be structurally stuck.

The composition is what matters. Network Infrastructure reached €2.04bn from €1.83bn, with Optical Networks up 20% year on year — particularly strong in the Americas — and IP Networks up 16% on a constant-currency basis, both explicitly attributed to AI and cloud demand. Technology and licensing grew 15%. Mobile Networks, the traditional core, grew about 7%. Fixed Networks shrank 2%. There are visibly two companies inside Nokia, and the AI-exposed one is growing roughly three times as fast as the legacy one.

Management is guiding accordingly: Network Infrastructure net sales growth of 12–14% on a constant-currency portfolio basis for 2026, with IP Networks and Optical Networks combined at 18–20%, full-year comparable operating profit of €2.1–€2.6bn, free cash flow conversion of 55–75% of comparable operating profit, and capex of just €800–900m. That last figure deserves attention. Nokia is participating in the AI infrastructure build without the capital intensity that defines the neocloud operators or the merchant power developers. It sells picks and shovels and keeps its balance sheet.

The strongest single data point is the order intake. AI & Cloud orders of €2.8bn in one quarter, up from roughly €1.0bn in Q1, sit against consensus 2026 revenue growth of just 4.3% and 2027 growth of 6.7%. Orders convert to revenue with a lag, and a book building at that rate is difficult to reconcile with mid-single-digit revenue modelling. Either the order intake proves lumpy and non-repeating, or the estimates that anchor the $15.02 consensus are too low.

The bear case: a 3.5% net margin meeting a cost shock

The bear case does not require the AI story to be false. It requires only that the margin arithmetic stays punishing. Nokia generated $808.87m of net income on $23.30bn of trailing revenue — a net margin of about 3.5%. Trailing EPS is $0.14 and the trailing P/E is 74. This is a business with almost no cushion, which is precisely why a component cost shock is dangerous. A few points of gross margin is the difference between the guidance range’s top and bottom.

The DRAM squeeze is not speculative, and it is not close to resolving — SanDisk used its investor day to argue memory stays tight into 2028. It is already in a competitor’s guidance, and Nokia buys from the same constrained suppliers into the same long-term customer contracts without automatic pass-through. The mitigation available — raising prices to telco customers — is slow, contested, and lands in a market where operators have spent a decade forcing equipment prices down. Nokia’s comparable gross margin of 46% has roughly 40 percentage points less room than Micron’s 84.9%.

There is also a credibility discount that is entirely earned. Nokia has announced strategic transformations repeatedly since 2013 without producing durable margin expansion, and a 5.60bn-share count means dilution has done real work over the years. The $8.50 low target implies roughly 21 times the 2027 consensus EPS of $0.40, which is not obviously cheap for a company the street models growing revenue 6.7%. The bear does not have to believe Nokia fails. It only has to believe Nokia remains a mid-single-digit grower with thin margins that briefly got repriced as an AI stock.

The numbers: what the range actually assumes

At $10.76 the market is paying about 24 times forward earnings, against consensus EPS of $0.34 for 2026 and $0.40 for 2027 on revenue of roughly $20.75bn and $22.13bn. The bull and bear targets are best read as multiples on that 2027 figure.

J.P. Morgan’s Sandeep Deshpande sits at the $21.00 high, set on 12 June — before the drawdown — which implies roughly 52 times 2027 EPS. That only works if the AI & Cloud order intake converts into materially higher estimates than consensus carries today. The freshest bullish marks came after the fall and after Q2: Northland’s Tim Savageaux at $20 and Craig-Hallum’s Christian Schwab at $15 on 24 July, with Bank of America’s Oliver Wong at $18 on 23 July. Argus’s Jim Kelleher also carries $15. The $8.50 floor implies about 21 times 2027 EPS and assumes component inflation eats the operating leverage before it reaches shareholders.

The honest read is that the consensus $15.02 is not a forecast so much as an average of two incompatible views. Roughly 39% upside to consensus from here is unusually wide for a European incumbent, and it exists because the analysts genuinely disagree about whether the memory squeeze is a two-quarter irritation or a two-year margin regime.

What happens next

Prediction one: Q3 is a margin print, not a revenue print. Ericsson has already told the market that component inflation builds gradually through the second half. Nokia’s Q3 comparable gross margin — 46% in Q2 — is the number that decides the next leg. Hold it near 46% and the bear case loses its mechanism. Slip toward 43–44% and the full-year €2.1–2.6bn operating profit range resolves to its lower half, which is roughly where the $8.50 case lives.

Prediction two: the order-to-revenue conversion becomes the whole argument by early 2027. A €2.8bn AI & Cloud quarter has to start appearing in reported Network Infrastructure sales. If IP and Optical track toward the top of the 18–20% guided range and the order book keeps building, estimates move up and the gap between $15 consensus and $20–21 bull targets closes from below. If the €2.8bn proves to be one large lumpy award, the re-rating stalls.

Prediction three: Nokia becomes a relative trade against the memory makers. Because the same shortage drives both, the cleanest expression of a view is no longer NOK alone but NOK against Micron or SanDisk. If DRAM pricing keeps climbing, memory wins and equipment loses. If HBM capacity additions finally loosen conventional DRAM in 2027, the trade reverses and Nokia gets its margin back without selling a single extra router.

The stock at $10.76 sits almost exactly between a bear case built on a cost line and a bull case built on an order book, which is a reasonable place for it to be given nobody yet knows which one compounds faster. What has changed is that Nokia is no longer a bet on telecom capex cycles. It is a leveraged position on the spread between AI networking demand and AI memory costs — and that is a far more interesting, and far more volatile, thing to own than what this company was two years ago.

Frequently asked questions

What is the bull case price target for Nokia stock?

The highest live street target is $21.00 from J.P. Morgan’s Sandeep Deshpande, set on 12 June 2026, implying about 95% upside from the $10.76 close on 14 August 2026. That target predates the July drawdown. The most recent bullish marks are Northland Securities at $20 and Bank of America at $18, both set in late July after Q2 results. The 11-analyst consensus is $15.02.

What is the bear case price target for Nokia stock?

The lowest live street target is $8.50, implying roughly 21% downside. That case rests on memory-chip cost inflation compressing gross margins faster than AI-driven revenue arrives. It values Nokia at about 21 times 2027 consensus EPS of $0.40 — a normal multiple for a company growing revenue in the mid-single digits with a 3.5% net margin.

Why did Nokia stock fall about 30% in July 2026?

It was not company-specific bad news. Ericsson reported a weak quarter and warned that surging memory-chip prices would compress equipment margins into 2027, triggering contagion selling across telecom equipment stocks. That coincided with a broad technology selloff and heavy profit-taking after Nokia had roughly quadrupled from $4.13. Nokia’s own Q2, reported 23 July, beat on profit.

How does the AI memory shortage hurt Nokia?

SK hynix, Samsung and Micron control over 95% of DRAM production and have shifted capacity toward high-bandwidth memory for AI accelerators, with HBM taking around 25% of wafer output by mid-2026. That tightens the conventional DRAM used in base stations. Because most telecom equipment contracts are long-term without automatic price-pass-through, vendors absorb the cost increase rather than passing it on immediately.

What did Nvidia’s investment in Nokia actually buy?

Nvidia invested $1bn for a 2.9% equity stake in October 2025, alongside a partnership to build an AI-RAN platform for 6G. The two also agreed to explore incorporating Nokia’s data centre switching and optical technology into Nvidia’s future AI infrastructure architectures. It is a strategic validation and a potential channel, not a guaranteed revenue commitment.

Is Nokia an AI stock or a telecom stock?

Both, and that is the point. Optical Networks grew 20% and IP Networks 16% in Q2 on AI and cloud demand, while Fixed Networks shrank 2% and Mobile Networks grew about 7%. Nokia guides Network Infrastructure to 12–14% growth in 2026 with IP and Optical combined at 18–20%. The AI-exposed segments are growing roughly three times faster than the legacy business, but the legacy business is still the larger part of the company.

This article is for information only and is not investment advice. Prices, analyst targets and estimates are as of the close on 14 August 2026 and will have changed.
The comparison everyone is making is wrong in a specific, checkable way. Applied Optoelectronics (NASDAQ: AAOI) is being pitched across retail feeds as “the next SanDisk” because both charts look the same — a sleepy component supplier that woke up and went vertical. But SanDisk’s move was a margin event and AAOI’s is a volume event, and that distinction decides whether $235 or $95 is the right number. SanDisk ran roughly 78% gross margin in its fiscal third quarter of 2026 as NAND pricing went parabolic. Applied Optoelectronics posted 27.7% GAAP gross margin in the June quarter — down from 30.3% a year earlier — while revenue grew 86.4%. AAOI closed at $150.28 on 14 August 2026, 35.7% below its own 52-week high of $233.67. Growing fast at a flat, thin margin is a different business than selling a scarce commodity into a shortage, and it deserves a different multiple.

Here is the synthesis that the “next SanDisk” framing misses entirely. Both stocks did run: SanDisk travelled from $42.82 to $2,354.39 across its 52-week range, a 55-fold move, and AAOI from $18.50 to $233.67, a 12.6-fold move. But pull the income statements and the engines are opposites. SanDisk’s revenue and its margin rose together, because a memory shortage lets the seller reprice existing capacity — that is operating leverage in its purest form. AAOI’s revenue nearly doubled while gross margin contracted 255 basis points and the loss from operations widened from $15.98m to $24.73m. Applied Optoelectronics is not repricing scarce supply. It is buying revenue with capacity, and paying for that capacity with shareholder equity. That is the whole bull-bear argument, and almost nobody is stating it in those terms.

Key facts

  • Q2 2026 revenue: $191.9m, up 86.4% year over year — a fifth consecutive record quarter — (AAOI Form 10-Q, filed 6 August 2026)
  • GAAP gross margin: 27.7%, versus 30.3% in Q2 2025 and 29.1% in Q1 2026 — falling on both comparisons — (AAOI Q2 2026 results, 6 August 2026)
  • GAAP net loss: $22.8m, or $(0.28) per share, versus a $9.1m loss a year earlier — (AAOI Form 10-Q)
  • Diluted share count: 81.6m, up 43.7% from 56.8m a year earlier — (AAOI Form 10-Q)
  • Q3 2026 guidance assumes ~92.8m shares — a further 13.8% dilution in a single quarter — (AAOI business outlook, 6 August 2026)
  • Inventories: $278.8m, up 52.3% since 31 December 2025; receivables up 28.5% to $314.0m — (AAOI Form 10-Q)
  • Spot: $150.28 at the 14 August 2026 close, 35.7% below the 52-week high — (daily closes, stockanalysis.com)

What is actually happening at Applied Optoelectronics

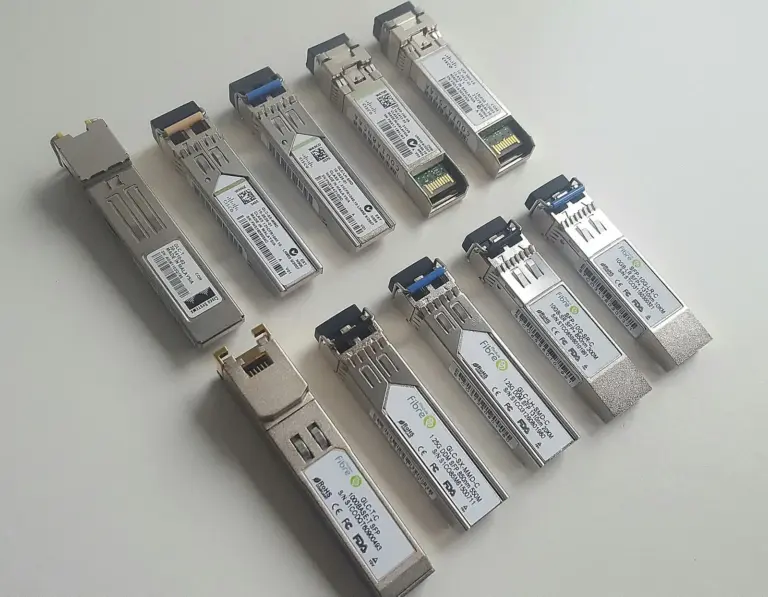
Applied Optoelectronics makes the optical transceivers that move data between racks inside a data centre. When an AI cluster outgrows the distance copper can carry a signal, the connection has to become light, and somebody has to make the module that converts it. That is AAOI’s business, and it has been a brutal one for most of the company’s history — a commodity supplier squeezed between hyperscale customers with enormous buying power and component costs it does not control.

The June quarter was genuinely good on the top line. Revenue of $191.9m beat consensus, data centre revenue reached $107.7m and crossed over to become 56.1% of the mix for the first time, and management said 800G product volume more than doubled sequentially. The legacy CATV business, which was the whole company not long ago, is now 42.0% of revenue and shrinking in relative terms. The third-quarter guide is aggressive: $255m to $290m, a midpoint 42% above the quarter just reported.

What did not improve is the part that matters for a 12-fold re-rating. Cost of goods sold rose from $71.8m to $138.7m, faster in percentage terms than the company’s ability to price. Operating expenses climbed to $77.9m against $47.1m. The result is that a business which grew revenue by $89m year over year converted none of it into operating profit — the operating loss got bigger. Guidance calls for non-GAAP gross margin of 29% to 30.5% in Q3, which is to say roughly where it was two years ago.

The gap between the headline and the filing is worth being precise about, because the headline everyone ran was “return to profitability.” That refers to non-GAAP net income of $5.5m, or $0.06 per diluted share. The GAAP figure in the same release is a net loss of $22.8m. Bridging those two numbers takes $28.3m of add-backs, and the company’s own reconciliation policy lists stock-based compensation, non-recurring expenses, amortisation of intangibles, unrealised FX, disposal losses and a non-GAAP tax adjustment among them. Neither number is dishonest. But an investor paying roughly 18 times trailing sales is paying for the first one.

Chief executive Dr. Thompson Lin framed the quarter this way in the results release: “Q2 was a pivotal quarter for AOI. We delivered record revenue for our fifth consecutive quarter and achieved an important milestone as we returned to non-GAAP profitability in the quarter. Further, we saw a strong volume ramp of our 800G products, which more than doubled sequentially.”

How the market and the analysts actually responded

The response has been unusually split, and the split is informative. Raymond James raised its target to $178 with an Outperform rating. B. Riley’s Dave Kang raised his to $109 but kept a Neutral rating — an analyst moving his number up while explicitly declining to recommend the shares. Consensus sits near $163. That is a wide band for a company this size, and wide analyst dispersion is generally a sign that the modelling assumptions, not the facts, are doing the work.

Retail sentiment is split even harder, and along platform lines. Aggregated sentiment trackers put X at roughly 66% bullish on AAOI against Reddit at about 13% — the same stock, the same week, near-opposite readings. That is not noise; it reflects two different holding periods looking at the same chart.

The sceptical case on Reddit is more sophisticated than the sentiment score suggests. In an r/investing thread arguing the shares are “trading at a price that is beyond reality,” one commenter made the cleanest version of the argument: “The high implied volatility is a sign the move is not based on fundamentals/long term fund positions.” Another described exiting semiconductor positions entirely “until I feel the bubble either pops, or the insanity of the hype dies down.” These are not people who dislike the company. They dislike the price.

On the demand side, the bulls have real numbers behind them. Industry work circulating this month puts total high-speed transceiver demand near 63 million units this year, close to triple the prior year, with McKinsey projecting that 800G manufacturing capacity falls 40% to 60% short of demand through 2027 and that 1.6T shortfalls persist into 2029. If that shortfall is real and AAOI holds its share of it, the revenue ramp has years to run. The question the bulls have not answered is why a multi-year shortage has not yet produced a single basis point of margin expansion.

Market impact: the SanDisk comparison, quantified

Set the two side by side and the “next SanDisk” thesis either survives or it does not.

Measure SanDisk (SNDK) Applied Optoelectronics (AAOI)
52-week range $42.82 – $2,354.39 $18.50 – $233.67
Low-to-high move 55.0x 12.6x
Recent gross margin ~78% (fiscal Q3 2026) 27.7% GAAP (Q2 2026)
Margin direction Expanding with price Contracting, −255bps YoY
Latest bottom line $6.90bn GAAP net income (fiscal Q4 2026) $(22.8)m GAAP net loss
What drives the move Commodity pricing cycle Unit volume and capacity

SanDisk’s fiscal fourth quarter produced $8.97bn of revenue and $6.90bn of GAAP net income — a company converting the majority of revenue into profit because memory prices moved and its cost base did not. That is what a genuine shortage looks like on an income statement. AAOI’s shortage, if it is one, is showing up as a bigger factory and a longer receivables line, not as pricing power.

Two balance-sheet items deserve attention from anyone modelling the bull case. Inventories rose 52.3% in six months, to $278.8m, and receivables rose 28.5%, to $314.0m — both faster than the six-month revenue growth rate of 69%. That is defensible if you are pre-building for a guided 42% sequential ramp. It is also exactly what it looks like when a ramp slips. The company does have the balance sheet to absorb a slip: cash stood at $499.7m at 30 June, up from $206.1m at year-end.

The dilution, however, is the item that a price target cannot ignore. Diluted shares went from 56.8m to 81.6m year over year, and the Q3 guidance is calculated on roughly 92.8m shares. A shareholder from twelve months ago owns materially less of each incremental dollar of revenue than the revenue chart implies. When you see AAOI’s revenue compared to its market capitalisation, remember that the denominator has been moving too. For a comparable framing on how AI-infrastructure names get repriced on capacity rather than earnings, our CoreWeave analysis after its Q2 print covers the same tension.

The accounting and disclosure tension

There is no securities-law problem here, and it should not be implied that there is. AAOI’s non-GAAP presentation is conventional, its reconciliation is published, and its policy statement describes each adjustment. The tension is narrower and more interesting: the SEC’s guidance on non-GAAP measures requires that GAAP results be presented with equal or greater prominence, and a company can satisfy that rule perfectly while the market still transmits only the non-GAAP number onward.

That is what happened here. The release states plainly that GAAP gross margin was 27.7% and that the GAAP net loss was $22.8m. The coverage that followed largely reported a return to profitability and a $0.06 beat. The disclosure worked; the transmission did not. For an investor, the practical rule is that on any company whose non-GAAP and GAAP lines have opposite signs, the reconciliation table is the primary document and the press release headline is commentary.

The second, real disclosure question is customer concentration. AAOI’s data centre business sells into a small number of hyperscale buyers, and its guided ramp depends on those specific programmes landing on schedule. Concentration cuts both ways at speed: it delivered the 86% growth, and a single postponed qualification would move a quarter. This is a structural feature of the optical module industry rather than a criticism of AAOI. It is also why the same demand forecast can support both a $235 and a $95 outcome depending on the timing of two or three customer decisions.

What happens next: the $235 bull case and the $95 bear case

The bull case to $235 (+56%). This requires the Q3 guide to land at or above its midpoint and, critically, for gross margin to break above the 30.5% guided ceiling in Q4 as 800G and 1.6T mix rises. If the McKinsey shortfall through 2027 is real, the first quarter in which AAOI prints a gross margin above 33% is the quarter the SanDisk comparison stops being lazy and starts being right. At that point a re-test of the 52-week high is straightforward, and the shares would be pricing a genuine pricing cycle rather than a volume ramp. Note honestly that $235 sits above the highest published analyst target we could verify — this is a scenario, not a consensus.

The bear case to $95 (−37%). This does not require the AI story to break. It requires only that margins stay near 30% while the share count keeps climbing toward and past 92.8m. On that path, revenue can grow 40% a quarter and the equity still de-rates, because the market eventually prices the business as a high-growth contract manufacturer rather than a shortage beneficiary. A round-trip to the early-August level near $110, then through B. Riley’s $109 Neutral target, gets to $95 without any operational disaster at all. The trigger to watch is a single quarter of sequential revenue growth accompanied by flat or lower gross margin.

The decisive datapoint arrives with the Q3 report. Revenue will almost certainly be a record; it is guided to be. Ignore it. The number that matters is gross margin, and the specific question is whether it printed above 30.5%. Everything else is already in the price.

Frequently asked questions

Is AAOI the same ticker as AAOL?
No. AAOL is a legacy symbol format for Applied Optoelectronics used on some terminals; the company trades on NASDAQ as AAOI. There is no separately listed security under AAOL.

Did Applied Optoelectronics make a profit in Q2 2026?
On a non-GAAP basis, yes — $5.5m, or $0.06 per diluted share. On a GAAP basis, no: the company reported a net loss of $22.8m, or $(0.28) per share. Both figures appear in the same 6 August 2026 release.

Why does gross margin matter more than revenue growth here?
Because the entire “next SanDisk” thesis assumes a shortage that lets the supplier raise prices. A shortage that raises prices shows up as margin expansion. AAOI’s margin fell 255 basis points year over year while revenue rose 86%, which is the signature of a volume ramp rather than a pricing cycle.

How much has AAOI diluted shareholders?
Diluted shares outstanding rose 43.7% year over year, from 56.8m to 81.6m. Third-quarter guidance is calculated on approximately 92.8m shares, implying a further 13.8% increase in a single quarter.

What are analysts targeting on AAOI?
The published range is wide. Raymond James carries $178 with an Outperform rating; B. Riley raised its target to $109 while keeping a Neutral rating. Consensus sits near $163 against a $150.28 spot price.

What would prove the bull case right?
A quarter in which gross margin breaks decisively above the 30.5% guided ceiling while revenue holds its ramp. That combination would demonstrate pricing power rather than capacity purchase, and would justify the comparison to a memory-cycle name.

Related reading on FinanceFeeds: our SanDisk SNDK bull and bear case sets out the memory-cycle comparison in full, the Fermi “next SanDisk” analysis applies the same test to a different candidate, and our Nokia price prediction covers the optical networking incumbent AAOI competes against. See also the Nebius case for AI infrastructure re-rating.

Sources: Applied Optoelectronics Form 10-Q for the quarter ended 30 June 2026 and Q2 2026 results release, both filed with the SEC on 6 August 2026; Sandisk fiscal Q4 2026 results; price data from stockanalysis.com as at the 14 August 2026 close.

This article is analysis, not investment advice. The bull and bear figures are scenarios constructed from published filings and guidance, not price targets or recommendations. Applied Optoelectronics is a high-volatility security and readers should conduct their own research.

Boston Scientific has lost more than half its value in eleven months, and almost every explanation you will read blames a slowdown. That is true but imprecise, and the imprecision is where the opportunity or the trap sits. The company’s June-quarter results were not weak: net sales rose 7.5% to $5.442bn, gross margin expanded 305 basis points to 70.7%, and operating income rose 43.8% to $1.178bn. What broke is narrower and more specific than “growth slowed” — and it is not visible in the headline franchise numbers. BSX closed at $51.83 on 14 August 2026, down 52.1% from its $108.14 peak close of 8 September 2025 and 45.3% year to date. It now trades at roughly 15.7 times the midpoint of its own full-year adjusted earnings guidance. The multiple, not the business, did the damage.

Here is the part almost nobody is quoting, and it comes out of the segment table in the 10-Q rather than the press release. Watchman revenue grew 4.3% and electrophysiology grew 9.0% — soft for franchises that carried this stock, but survivable. Split them by geography and the picture changes completely: US Watchman grew 2.9% and US electrophysiology grew 3.2%, while the same two franchises grew 20.0% and 23.0% internationally. The international strength is masking a near-stall in the market that sets the multiple. That is a materially different problem from a global deceleration, because it points at US competition and US account penetration rather than at demand for the therapy. Everything in the bull and bear case below turns on whether that US line reaccelerates.

Key facts

  • Q2 2026 net sales: $5.442bn, up 7.5% reported and 7.0% organic — (Boston Scientific Form 10-Q, filed 3 August 2026)
  • Gross margin: 70.7%, up 305 basis points from 67.7% a year earlier — (Form 10-Q)
  • Operating income: $1.178bn, up 43.8%; operating margin 21.6% versus 16.2% — (Form 10-Q)
  • US Watchman +2.9%, US electrophysiology +3.2% — against +20.0% and +23.0% internationally — (Form 10-Q franchise table)
  • Full-year organic revenue guidance cut to 5–6% from 5–7%; Q3 organic guided to just 3–5%(Q2 2026 results, 29 July 2026)
  • Cash fell to $539m from $1.965bn at year-end, with current debt obligations up to $1.709bn from $299m — (Form 10-Q)
  • $14.5bn Penumbra acquisition pending, announced 15 January 2026 at $374 per share, 73% cash — (Boston Scientific announcement, 15 January 2026)
  • Spot: $51.83 at the 14 August 2026 close, 52.1% below the peak close — (daily closes, stockanalysis.com)

What actually happened to the share price

This was not a drift. It was two step-downs and a long grind between them, and the dates matter because each one repriced a different assumption.

On 4 February 2026 the stock fell 17.59% in a single session, closing at $75.50. That was the quarter where forward guidance came in below expectations and the market first questioned whether the double-digit organic growth algorithm was intact. On 27 May 2026 it fell a further 12.46% to $50.46, when management signalled that Watchman revenue would be roughly flat sequentially. Between and after those two days the shares ground to a trough close of $42.63 on 14 July before recovering to the current $51.83, which is 22.8% above that low.

The important thing about both drops is what they were not. Neither was a profit warning in the conventional sense, and neither followed a revenue miss. Q2 adjusted earnings per share of $0.86 came in above the company’s own $0.82–$0.84 guidance range and grew 15% year over year — though management noted the beat was helped by favourable tax results, which is worth discounting. Revenue beat. Margins expanded. What the market sold was the growth rate, and specifically the durability of the growth rate.

That distinction is the whole investment case. A company that misses on profitability has an execution problem. A company that beats on profitability while its two flagship US franchises decelerate to low single digits has a competitive problem, and competitive problems take longer to fix but do not usually impair the cash flows in the meantime.

Where the growth actually went

The franchise detail in the quarterly filing is unusually clear once you separate US from international.

Franchise (Q2 2026) US growth International growth Total
Interventional Cardiology & Vascular +17.4% +9.9% +13.2%
Interventional Oncology & Embolization +12.9% +12.5% +12.7%
Electrophysiology +3.2% +23.0% +9.0%
Watchman +2.9% +20.0% +4.3%
Cardiac Rhythm Management −1.7% +0.4% −0.8%

Two franchises are still compounding at low-to-mid teens in the United States. Cardiac rhythm management is in mild decline, which is a structural, long-understood feature of that market rather than news. The anomaly is electrophysiology and Watchman: both grew more than 20% internationally and both stalled domestically, in the same quarter, in the same segment.

The internal contrast is what makes this diagnosable. If the therapy itself were losing favour, international growth would not be running above 20%. If it were a pricing problem, margins would not have expanded 305 basis points. The most consistent reading of these numbers is that the US market for pulsed-field ablation and left-atrial-appendage closure has become genuinely competitive at exactly the point where Boston Scientific had the highest share and the least room to add new accounts — while international markets are still in the earlier, land-grab phase of the same adoption curve.

At the segment level, cardiovascular grew 8.3% and MedSurg 5.9%, giving the 7.5% total. Neither is a bad number in absolute terms. Both are far below what a stock priced in the mid-thirties on forward earnings, as BSX was a year ago, requires.

The mechanism behind the US stall is worth stating plainly, because it determines whether it is temporary. Pulsed-field ablation — the technology underneath the electrophysiology franchise — moved from novelty to standard of care in US cardiac centres extraordinarily fast, and Boston Scientific was the principal beneficiary of that shift. Being first into a rapidly adopted category produces spectacular growth rates for as long as there are untreated accounts to convert. It also means that when rival systems reach the market, the incumbent has the most share to defend and the fewest new hospitals left to sign. The same logic applies to Watchman, where Boston Scientific has been the dominant left-atrial-appendage closure device for years. International growth above 20% in both franchises is not a contradiction of this reading — it is confirmation of it, because those markets are two to three years behind the US on the same adoption curve.

If that reading is right, the US lines do not snap back to double digits. They stabilise somewhere in the mid single digits as a mature, defended, high-margin business, and the international ramp carries group growth for the next several years. That is a perfectly good company. It is simply not the company the September 2025 share price was describing.

The valuation reset, and the deal underneath it

Full-year guidance now calls for 5–6% organic revenue growth and adjusted EPS of $3.28–$3.32, up 7–8%. Third-quarter organic growth is guided at 3–5%. At $51.83, the shares trade on about 15.7 times the $3.30 guidance midpoint. Analyst consensus, which fell 13% after the second-quarter report, now sits at $62.69 — and the rating distribution has not broken: of 29 analysts, 26 rate the stock a buy, five a hold, and none a sell. That combination, sharply reduced targets with an intact buy rating, is the signature of a de-rating rather than a thesis collapse.

The half-year figures reinforce the point that this is a de-rating rather than a deterioration, with one caveat worth flagging. Across the first six months of 2026, net sales rose 9.5% to $10.646bn, operating income rose 31.0% to $2.279bn, and net income attributable to common stockholders rose 52.8% to $2.247bn, taking diluted EPS to $1.51 from $0.98. That last figure is flattered and should not be annualised: the company recorded a discrete tax benefit in the first quarter, which turned the six-month income tax line into a net benefit of $21m against a $279m expense a year earlier. Strip the tax effect and the underlying improvement is still real but far less dramatic — which is exactly why the adjusted EPS guidance of $3.28–$3.32, rather than the reported first-half number, is the right basis for a multiple.

One further detail cuts against the idea of a company in trouble: the diluted share count fell to 1,474.8m from 1,493.5m a year earlier, a reduction of about 1.3%. Boston Scientific has been retiring stock rather than issuing it, even while assembling cash for a very large acquisition. Inventories rose 9.9% to $3.235bn, broadly in line with sales growth rather than running ahead of it, which argues against a channel-stuffing or destocking problem sitting behind the US deceleration.

What almost no coverage connects is the timing of the balance sheet. On 15 January 2026 — three weeks before the first 17.6% drop — Boston Scientific agreed to acquire Penumbra for approximately $14.5bn, at $374 per Penumbra share, structured roughly 73% cash and 27% stock, with closing expected in the second half of 2026. It is the company’s largest acquisition in around two decades and takes it deep into mechanical thrombectomy and neurovascular devices.

The consequences are already visible in the filing. Cash and equivalents fell from $1.965bn at 31 December to $539m at 30 June, other investments rose from $681m to $2.245bn, and current debt obligations jumped from $299m to $1.709bn. Boston Scientific is pre-positioning to fund a very large cash acquisition at the same moment its two highest-multiple franchises decelerated in their home market. That is the actual risk, and it is a sequencing risk rather than a solvency one: leverage stood at 2.02 times against a 4.00 times covenant limit, so the balance sheet has real room.

For readers tracking how the market is repricing growth names on multiple rather than earnings this month, our HIMS bull and bear analysis covers the same mechanic in a healthcare context, and today’s Applied Optoelectronics analysis shows the mirror image — a stock where the multiple expanded while margins fell.

What has to be true for each case

The bull case to $72 (+38.9%). This does not require a return to double-digit organic growth. It requires two things: that US electrophysiology and Watchman stop decelerating — stabilising in the mid single digits is enough — and that Penumbra closes on schedule and is integrated without a guidance reset. On the $3.30 adjusted EPS midpoint, $72 is about 21.8 times earnings, which is a normal multiple for a large-cap medical device company with 70% gross margins and a 21.6% operating margin. This is a re-rating case, not a growth-reacceleration case, and that is precisely what makes it plausible. It sits above the $62.69 consensus, so treat it as the upper scenario rather than the base.

The bear case to $40 (−22.8%). This requires the US stall to persist into 2027 and spread. If electrophysiology and Watchman go from low-single-digit growth to flat or negative in the US while international decelerates off its own high base, full-year organic growth drops toward 3–4% and adjusted EPS growth toward the low single digits. A company growing earnings 3% does not hold a 15.7 times multiple; 12 times on $3.30 is $39.6. That path breaks the 52-week low of $42.20 and would likely be accompanied by Penumbra integration costs arriving before Penumbra revenue synergies. Note that no analyst currently carries a sell rating, which means this scenario is not priced by the sell side at all.

The tell to watch is not the revenue line. It is the US electrophysiology and Watchman growth rates in the third-quarter filing, which the company breaks out by geography. Two consecutive quarters of US growth below 3% would confirm the bear path; a print back above 6% would make the current multiple look like the mistake.

Frequently asked questions

Why has Boston Scientific stock fallen so much in 2026?
Not because of losses — the company is more profitable than a year ago. The decline came from two guidance-driven sessions: a 17.6% drop on 4 February 2026 after soft forward guidance, and a 12.5% drop on 27 May 2026 after management signalled flat sequential Watchman revenue. The market re-rated the growth multiple rather than the earnings.

Is Boston Scientific still profitable?
Yes, and increasingly so. Second-quarter operating income rose 43.8% to $1.178bn, gross margin expanded 305 basis points to 70.7%, and GAAP diluted EPS rose to $0.61 from $0.53. Adjusted EPS of $0.86 beat the company’s own guidance range.

What is the Watchman problem?
Watchman is Boston Scientific’s left-atrial-appendage closure device. US revenue grew only 2.9% year over year in Q2 2026, against 20.0% growth internationally. Management indicated revenue would be roughly flat sequentially, which triggered the May sell-off. The issue appears to be US competition and account saturation rather than falling demand for the therapy.

What is Boston Scientific buying Penumbra for?
Penumbra is a mechanical thrombectomy and neurovascular device maker. The deal was announced on 15 January 2026 at roughly $14.5bn, or $374 per Penumbra share, paid approximately 73% in cash and 27% in stock, with closing expected in the second half of 2026. It returns Boston Scientific to the neurovascular market it exited in 2011.

Is BSX cheap at these levels?
On the numbers, it trades at about 15.7 times the midpoint of full-year adjusted EPS guidance of $3.28–$3.32, against a consensus price target of $62.69. Whether that is cheap depends entirely on whether 5–6% organic growth is the new normal or a trough. A 15.7 multiple is undemanding for a business with 70% gross margins and demanding for one growing 3%.

What would change the thesis fastest?
The geographic split of electrophysiology and Watchman growth in the third-quarter report. Those two lines, US only, are the variables the entire re-rating hangs on.

Related reading on FinanceFeeds: our Nokia bull and bear case and the Reddit RDDT price prediction apply the same scenario framework to different sectors, while the Nebius post-Q2 analysis covers a name repricing in the opposite direction.

Sources: Boston Scientific Form 10-Q for the quarter ended 30 June 2026, filed with the SEC on 3 August 2026; Q2 2026 results announced 29 July 2026; the Penumbra acquisition announcement of 15 January 2026; price data from stockanalysis.com as at the 14 August 2026 close.

This article is analysis, not investment advice. The bull and bear figures are scenarios constructed from published filings and company guidance, not price targets or recommendations. Readers should conduct their own research before making investment decisions.

Microsoft spent $115.9bn on property and equipment in the twelve months to 30 June 2026, and the market’s opinion of that number reversed twice inside six months. On 29 January the shares fell 9.99% in a session as capital expenditure was read as a margin problem. On 30 July they rose 15.51% — the largest single-day gain in years for a company this size — as the same spending was read as an investment thesis. Nothing about the cash outflow changed between those two days. What changed was the evidence of return. MSFT closed at $495.40 on 14 August 2026, still 8.6% below its October 2025 peak close and down 5.2% over twelve months, despite fiscal 2026 revenue rising 18% to $331.8bn and operating income rising 21% to $155.2bn. This is a stock where the argument is entirely about one line in the cash flow statement.

The number that reframes the debate is not the capex figure at all. It is the backlog. Microsoft’s commercial remaining performance obligation — contracted revenue not yet recognised — rose 84% to $678bn in fiscal 2026. That is roughly 2.0 times the company’s entire annual revenue, already signed. Set against $115.9bn of annual capex, the ratio matters more than the absolute: the company is not spending into hope, it is spending against a contracted order book that grew four times faster than revenue did. The bear case has to argue that the backlog converts more slowly, at worse margins, or later than the depreciation schedule assumes. That is a real argument, and the 10-K itself supplies its best evidence.

Key facts

  • FY2026 revenue: $331.8bn, up 18%; operating income $155.2bn, up 21% — (Microsoft Form 10-K, filed 29 July 2026)
  • GAAP diluted EPS $17.95, up 32%; adjusted diluted EPS $17.28, up 22% — (Form 10-K)
  • Capex: $115.9bn, against $64.6bn in FY2025 and $44.5bn in FY2024 — up 79.6% in a year and 2.6× in two — (Form 10-K cash flow statement)
  • Commercial RPO up 84% to $678bn — about 2.0× annual revenue — (Form 10-K)
  • Azure and other cloud services revenue up 41% for the year, and 43% in the June quarter, its fastest since early 2022 — (Form 10-K; Q4 FY2026 results, 29 July 2026)
  • Microsoft Cloud gross margin fell to 66%, which the company attributes to AI infrastructure investment — (Form 10-K)
  • Cash and short-term investments fell to $76.8bn from $94.6bn a year earlier — (Form 10-K)
  • Spot: $495.40 at the 14 August 2026 close; 52-week range $349.20–$553.72 — (daily closes, stockanalysis.com)

The two days that defined the year

Microsoft’s twelve-month chart is not a trend. It is a cliff, a trough and a vertical recovery, and each segment has a specific cause.

The shares peaked at a $542.07 close on 28 October 2025. The decline that followed accelerated on 29 January 2026, when the stock fell 9.99% to $433.50, and continued through a 4.95% drop on 5 February to $393.67. The market’s concern in that window was straightforward: capital expenditure was scaling faster than the revenue attributable to it, cloud gross margin was compressing, and the depreciation from those assets would arrive on the income statement whether or not AI demand did. The shares bottomed at a $352.83 close in the spring — roughly 35% below the October peak.

Then came 30 July 2026. Fourth-quarter revenue of $90.01bn rose 18%, adjusted EPS of $4.74 rose 23%, and Azure grew 43% — beating the roughly 40% consensus and marking the fastest quarterly growth since early 2022. Azure’s annualised revenue crossed $100bn for the first time. Critically, quarterly capex came in at about $41bn against roughly $42bn expected, and free cash flow beat consensus by 46%. The stock rose 15.51% from $390.54 to $451.10 and has added a further 10% since.

The lesson traders took from that sequence is worth stating precisely, because it defines what to watch next. The market never objected to the spending in principle. It objected to spending without a visible, accelerating return. When Azure accelerated and capex came in slightly under plan and free cash flow beat, all three objections resolved at once. That is why the reaction was violent rather than incremental. Our coverage on the day, Microsoft’s capex rewarded while Meta’s was punished, set out how differently the market treated two very similar spending programmes in the same week.

What the fiscal 2026 accounts actually show

Full-year results were strong on every operating line, with one caveat that cuts against the headline.

Fiscal 2026 Amount Change
Revenue $331.8bn +18%
Gross margin $225.5bn +16%
Operating income $155.2bn +21%
GAAP net income $133.7bn +31%
GAAP diluted EPS $17.95 +32%
Adjusted diluted EPS $17.28 +22%
Capital expenditure $115.9bn +79.6%

Note the relationship between the two earnings lines. GAAP net income grew 31% while adjusted net income grew 22%, and GAAP EPS grew 32% against adjusted EPS growth of 22%. The gap runs in the unusual direction: the reported figure is higher than the adjusted one, because Microsoft’s non-GAAP measure strips out net gains from investments. In a year when equity and other investments rose from $15.4bn to $36.3bn, those gains were substantial. The honest read is that $17.28, not $17.95, is the number to build a multiple on — and that the 22% growth rate, not 32%, is the underlying one.

Gross margin percentage slipped: gross profit grew 16% against revenue growth of 18%, and Microsoft Cloud gross margin specifically fell to 66%, which the filing attributes to AI infrastructure investment and rising AI product usage, partly offset by efficiency gains in Azure and Microsoft 365. This is the mechanical cost of the buildout showing up exactly where you would expect it, and it is why margin, not revenue, is the line the bears watch.

The scale underneath those percentages is easy to lose. Microsoft Cloud revenue rose 27% to $214.4bn in fiscal 2026 — a single reporting line larger than all but a handful of companies in the S&P 500. Azure sits inside it and grew 41% for the year, which means the fastest-growing component is also one of the largest. Growth of that order at that base is the reason the market tolerates a premium multiple at all, and it is why a deceleration of five percentage points in Azure matters more to the share price than almost anything else the company reports.

One cash-flow detail deserves more attention than it has received. Cash used in investing rose $66.9bn to $139.5bn, and the filing attributes that net increase principally to two things: a $51.4bn rise in additions to property and equipment, and a further $22.2bn rise in other investing activity “primarily to facilitate the purchase of components,” partly offset by lower spending on acquisitions and other items. Microsoft is committing cash to secure physical supply, not only to build shells. That is a rational response to a constrained market for accelerators and memory, and it is also a second, less visible call on the balance sheet that does not appear in the headline capex number most commentary quotes.

At $495.40 against adjusted EPS of $17.28, Microsoft trades on about 28.7 times trailing adjusted earnings, with a market capitalisation near $3.68trn on 7.43bn shares outstanding. The dividend, at $3.64 declared per share, yields about 0.7% — this is not a stock anyone owns for income. Buybacks continued through the buildout rather than pausing for it: the company repurchased 36 million shares in fiscal 2026, up from 31 million in fiscal 2025.

The capex tension, in Microsoft’s own words

The most useful sentence for a bear is not in any analyst note. It is in Microsoft’s own risk factors, where the company describes its AI buildout as being made “at significant scale and on an accelerated timeline,” requiring “substantial and increasing capital expenditures and continued access to capital,” and — the key clause — being made “in advance of fully developed revenue streams.”

That is the company stating plainly that the spending precedes the revenue. It is a fair and standard disclosure rather than a warning, but it defines the risk precisely: assets bought today are depreciated over a fixed schedule regardless of how quickly the $678bn backlog converts. If conversion runs behind depreciation, operating margin compresses even while revenue grows. Cash and short-term investments already fell $17.8bn to $76.8bn over the year, and cash used in investing rose $66.9bn to $139.5bn.

The counterweight is that Microsoft is funding this from operations while still returning capital — it repurchased 36 million shares during the year and declared $3.64 a share in dividends, with total stockholders’ equity ending at $442.4bn. This is not a balance sheet under strain. It is a balance sheet being deliberately redeployed, and the same tension is playing out across the hyperscalers, as our analysis of Amazon raising capex to $220bn and still beating expectations shows.

One further consideration that has faded from the narrative but has not disappeared: Microsoft’s quantum computing programme. It contributed to sentiment in early 2026 and remains genuine long-dated optionality, but it produces no revenue today and should carry no weight in a twelve-month price target. Treat it as a free option, not a line in the model.

The $640 bull case and the $380 bear case

The bull case to $640 (+29.2%). This requires Azure to hold growth near 40% through fiscal 2027 while capex growth decelerates from 79.6% toward something closer to 25–30%. That combination — revenue growth sustained, spending growth slowing — is what produces operating leverage, and it is exactly the combination the 30 July print delivered for one quarter. On roughly $20.75 of fiscal 2027 adjusted EPS, which assumes 20% growth from $17.28, $640 is about 31 times forward earnings. That is a premium multiple, but Microsoft has traded there before with slower Azure growth and a far smaller backlog. Consensus sits at $569.56 across 56 analysts, with Citi, Morgan Stanley and UBS all endorsing $600; $640 is above the average but well inside the $870 street high.

The bear case to $380 (−23.3%). This does not require an AI winter. It requires only that the $678bn backlog converts more slowly than the depreciation schedule on $115.9bn of annual capex assumes. In that scenario cloud gross margin drifts below 66%, adjusted EPS growth decelerates from 22% toward low double digits, and a 28.7 multiple is no longer defensible on a low-teens grower. Roughly 22 times $17.28 gives $380. That level would revisit the spring lows and sit below the lowest published analyst target of $400 — worth stating plainly, because no analyst currently models it and the sell side carries zero Sell ratings on the stock.

The signal that resolves this is narrow and dated. It is the Azure growth rate alongside quarterly capex in the next two reports. Azure above 38% with capex growth decelerating validates the bull path. Azure below 33% with capex still climbing validates the bear path. Everything else — Copilot seat counts, quantum milestones, headline EPS beats flattered by investment gains — is secondary to those two numbers printed side by side.

Frequently asked questions

Why did Microsoft stock fall in early 2026 and recover in July?
The stock fell 9.99% on 29 January 2026 on concern that AI capital expenditure was outpacing the revenue it generated, and bottomed near $353. It rose 15.51% on 30 July 2026 when fourth-quarter results showed Azure accelerating to 43% growth, capex slightly below expectations at about $41bn, and free cash flow 46% ahead of consensus.

How much is Microsoft spending on AI infrastructure?
Additions to property and equipment totalled $115.9bn in fiscal 2026, against $64.6bn in fiscal 2025 and $44.5bn in fiscal 2024 — an increase of 79.6% in one year and roughly 2.6 times over two. That is about 34.9% of total revenue.

What is Microsoft’s remaining performance obligation?
Commercial RPO — contracted revenue not yet recognised — rose 84% to $678bn in fiscal 2026, roughly two times annual revenue. It is the strongest single data point in the bull case because it represents demand already signed rather than forecast.

Is Microsoft’s EPS growth as strong as it looks?
Not quite. GAAP diluted EPS rose 32% to $17.95, but adjusted diluted EPS rose 22% to $17.28. The adjusted figure excludes net gains from investments, which were large in a year when equity and other investments rose from $15.4bn to $36.3bn. The 22% figure is the better basis for valuation.

What multiple does Microsoft trade on?
About 28.7 times trailing adjusted earnings at $495.40, giving a market capitalisation near $3.68trn on 7.43bn shares. The dividend yield is roughly 0.7%.

What should investors watch next?
Two numbers in the same table: the Azure growth rate and quarterly capital expenditure. Sustained Azure growth with decelerating capex growth is the bull path; decelerating Azure with rising capex is the bear path.

Related reading on FinanceFeeds: our longer-horizon Microsoft forecast for 2026, 2027 and 2030 covers the multi-year view, while the Boston Scientific bull and bear case and the Applied Optoelectronics analysis apply the same scenario framework elsewhere.

Sources: Microsoft Form 10-K for the fiscal year ended 30 June 2026, filed with the SEC on 29 July 2026; fourth-quarter fiscal 2026 results announced 29 July 2026; price data from stockanalysis.com as at the 14 August 2026 close; analyst consensus per published price targets.

This article is analysis, not investment advice. The bull and bear figures are scenarios constructed from published filings and company disclosures, not price targets or recommendations. Readers should conduct their own research before making investment decisions.

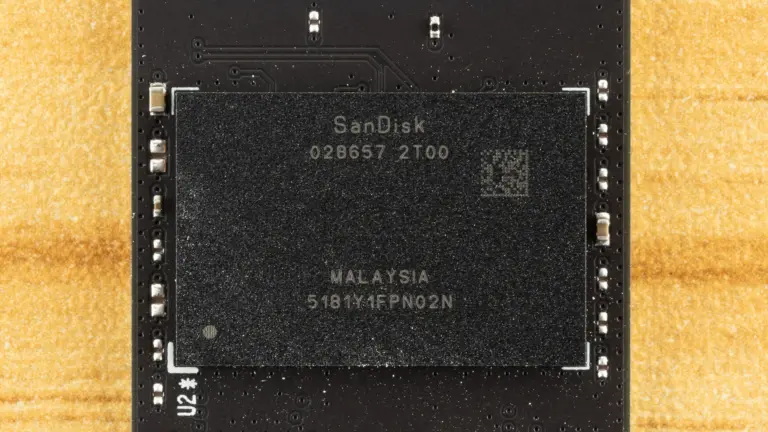
NAND Flash contract prices were forecast to rise 70% to 75% quarter over quarter in Q2 2026 as AI-server demand redirected supply toward enterprise storage, according to TrendForce’s second-quarter memory pricing survey. The increase followed an 85% to 90% first-quarter forecast and left consumer-device manufacturers facing higher costs before substantial new production capacity can arrive.

The mechanism behind the shortage is visible in where the output is going. Enterprise SSDs absorbed 48% of global NAND bits in Q2, up from 26% a year earlier, as AI inference increased demand for high-capacity server storage. Counterpoint Research expects servers to consume more than half of all NAND bits by the end of 2026.

That shift helps explain why the price increase cannot be reduced to a temporary rebound in smartphone or PC demand. Suppliers are directing more NAND output toward enterprise SSDs, while the investment decisions needed to add meaningful capacity will take years to affect production.

Enterprise SSDs Are Taking Nearly Half of NAND Supply

Training large AI models concentrates attention on accelerators and high-bandwidth memory, but inference creates another storage requirement. Models serving large numbers of users need rapid access to datasets, embeddings and cache data, increasing demand for high-capacity enterprise SSDs alongside conventional server memory.

Counterpoint said the migration from training toward inference pushed enterprise SSDs to 48% of NAND bit shipments during Q2. The resulting shortage left less supply available for consumer products and drove consumer NAND selling prices to record levels.

The effect has reached retail storage and device pricing. IDC said manufacturers including Lenovo, Dell, HP, Acer and Asus had warned customers about higher PC costs, with some price adjustments and contract resets reaching 15% to 20%. IDC’s downside scenarios put the potential increase in PC average selling prices at 4% to 8%, depending on how long the shortage lasts.

Smartphone manufacturers face a similar problem because memory can account for 15% to 20% of the bill of materials in a mid-range handset. Higher NAND and DRAM costs leave manufacturers choosing between raising retail prices, reducing storage and memory specifications, or accepting lower margins.

NAND and DRAM Are Tight for Different Reasons

The two memory markets are connected, but the supply mechanisms should not be treated as identical. High-bandwidth memory uses DRAM production capacity, so increased HBM output directly restricts the wafers and cleanroom space available for conventional DRAM used in PCs, smartphones and general-purpose servers.

NAND pressure is driven more directly by enterprise SSD allocation, restrained capital spending and suppliers’ preference for higher-value storage products. TrendForce has also said some manufacturers are directing resources toward the more profitable DRAM market, limiting the speed at which NAND capacity can expand.

Conventional DRAM contract prices increased approximately 93% to 98% in Q1, according to TrendForce’s post-quarter industry analysis. The firm then forecast another 58% to 63% increase for Q2 as suppliers continued prioritizing servers and HBM.

The concentration of DRAM production gives those allocation decisions broader consequences. Samsung, SK Hynix and Micron account for close to 90% of the market, leaving device manufacturers with few alternative sources when the three producers prioritize AI-related products. The same supply pressure has supported the investment case around Micron as its revenue and margins rise with memory prices.

China’s CXMT is adding conventional DRAM production, but it does not yet provide a near-term substitute for the leading HBM suppliers. Its expansion, including the capacity plans discussed around its Shanghai market debut, is more relevant to commodity DRAM than to the advanced HBM products driving AI accelerator deployments.

Price Growth Is Slowing, but Prices Are Not Falling

TrendForce’s July outlook forecast that NAND contract-price growth would moderate to 10% to 15% in Q3. The slowdown was attributed to record price levels, weaker consumer demand and resistance from PC and smartphone manufacturers that had reached the limits of what they could absorb.

That is a deceleration from the 70% to 75% Q2 forecast, not a reversal. The distinction matters because a lower rate of increase can coexist with record prices, reduced transaction volumes and limited availability for buyers outside long-term supply agreements.

Spot-market figures also require care. A Bloomberg-reported increase of nearly 700% applied to selected legacy DRAM spot products rather than the entire DRAM market or the contract prices paid by large manufacturers. Spot prices can move more sharply because they cover incremental supply outside negotiated contracts.

Sourceability separately reported that NAND prices had risen 246% from the beginning of 2025 through December, attributing the figure to Kingston. That measure should not be combined directly with TrendForce’s quarterly contract-price ranges because the periods, products and transaction channels differ.

New Capacity Cannot Respond Quickly

Memory manufacturers cannot resolve the shortage simply by increasing output at existing facilities. Cleanroom construction, equipment installation, process qualification and yield improvement can take several years before a new fab reaches volume production.

TrendForce said meaningful NAND capacity expansion was unlikely before late 2027 or 2028. IDC also expects the memory shortage to persist well into 2027, with 2026 DRAM and NAND supply growth remaining below historical levels at 16% and 17%, respectively.

Most near-term supply growth must therefore come from process migrations that increase the number of bits produced from each wafer. Those gains help at the margin, but they do not match the increase in enterprise storage demand when AI servers are taking a rapidly growing share of total output.

The delay also limits the speed at which producers can respond to high prices without creating another oversupply cycle. Memory companies spent years cutting output and capital expenditure after the previous downturn, making them cautious about approving capacity that may enter production after market conditions have changed.

SanDisk’s Forecast Is Aggressive but Has Supply Data Behind It

SanDisk used its 13 August Investor Day to estimate that NAND industry revenue would exceed $300 billion in 2026 and reach $500 billion in 2027, with supply remaining allocated beyond that year. The company’s forecast is substantially more aggressive than a normal cyclical recovery and should be treated as management guidance rather than independent market consensus.

However, the supporting operating figures explain why investors gave the forecast weight. SanDisk generated approximately $8.97 billion in fiscal fourth-quarter revenue, up 51% sequentially, with a non-GAAP gross margin of 84.6%. Management attributed roughly two-thirds of the sequential revenue increase to pricing and one-third to higher volume.

The company also said demand from customers was growing faster than its available supply. Its longer-term agreements covered about half of expected fiscal 2027 bit shipments and approximately two-thirds of fiscal 2028 shipments, giving it more revenue visibility than memory producers typically have during a price cycle.

Those disclosures extend the supply thesis examined before SanDisk’s Investor Day and after options markets priced a large move around its results. They also help explain the read-across to Western Digital’s storage business, even though the companies now carry different direct exposures following their separation.

The central question is no longer whether memory prices have risen. It is whether enterprise demand can remain strong enough to absorb production gains before new facilities reach volume output. With enterprise SSDs already taking 48% of NAND bits and major capacity relief still years away, suppliers retain pricing power even as consumer resistance slows the rate of increase.

Once a destination for some of the world’s most selective luxury shoppers, an iconic retailer is facing one of the biggest turning points in its nearly two-century history.

Years of financial losses and mounting challenges have put the business under serious pressure, with its owner warning that it could not survive much longer without new investment.

Now, after months of uncertainty, the retailer’s future is once again hanging in the balance.

Founded in 1831, Harvey Nichols is a British luxury department store chain known for its upscale designer fashion, beauty products, fine wines, and gourmet food. The company operated 12 stores worldwide.

Harvey Nichols warned it could shut down next year

Harvey Nichols’ financial challenges intensified this year, prompting its owner, Hong Kong luxury goods businessman Dickson Poon, to put the retailer up for sale in June 2026.

Poon acquired Harvey Nichols in 1991 for £53 million from Debenhams and the Burton Group. After 35 years of ownership, he began seeking a buyer or a new investor as the retailer struggled with mounting losses and a lack of profitability.

The retailer had not returned to profit since the Covid pandemic and warned that it could collapse within a year without new investment.

Harvey Nichols reported a £105 million ($142 million) loss after tax for the year ended March 29, 2025, after writing off inter-company loans, according to the company’s annual report and financial statements.

Revenue fell from £204.8 million ($277 million) to £184.8 million ($250 million) in the year, while pre-tax losses widened from £34 million ($46 million) to £49 million ($66 million). The retailer’s accumulated pre-tax losses had reached more than £140 million ($189 million) over five years.

The figures highlight the depth of the retailer’s financial problems as it faced weaker consumer demand, higher operating costs, online competition, and changes in international shopping patterns. The end of tax-free shopping for tourists in the U.K. has also weighed on luxury retailers that rely on international visitors.

Harvey Nichols attracted interest from multiple potential buyers during the sale process, although some prospective bidders withdrew. Frasers Group ultimately emerged as the successful buyer.

Harvey Nichols is acquired by Frasers Group

After months of uncertainty, Harvey Nichols was acquired by Mike Ashley’s Frasers Group on Aug. 13 through a pre-pack administration.

The deal allows Frasers Group to take control of Harvey Nichols’ operating assets, while the retailer’s existing liabilities are addressed through the administration process.

The transaction includes Harvey Nichols’ six U.K. stores in Manchester, Birmingham, Bristol, Leeds, Edinburgh, and the Knightsbridge flagship in London, as well as its online business, existing inventory, and more than 1,000 employees.

International franchise agreements are also included, with those locations continuing to operate under existing licensing arrangements.

The future of the Dublin location remains under discussion, while the OXO Tower restaurant in London was excluded from the transaction.

Frasers Group has not officially disclosed the purchase price. However, multiple reports have put the transaction value at approximately £40 million ($54 million), according to Forbes.

The acquisition marks the end of Poon’s 35-year ownership of Harvey Nichols and gives Frasers Group control of one of Britain’s best-known luxury retail names.

“The turnaround will require tough choices, and we are prepared to make those decisions, even if that means a smaller business in the near term, to create a stronger and more sustainable Harvey Nichols for the long term,” said Frasers Group CEO Michael Murray in a statement.

Harvey Nichols is acquired out of insolvency by Frasers Group.

Bloomberg / Getty Images

What the acquisition means for Harvey Nichols’ future

The acquisition does not mean Harvey Nichols’ problems are over.

Frasers Group said it will review and potentially rationalize Harvey Nichols’ store portfolio, organizational structure, operating model, and cost base as it works to create a sustainable business.

That could eventually mean a smaller Harvey Nichols, with Frasers Group warning that significant changes will be necessary to return the retailer to profitability.

Here’s some of my previous coverage of retail business news:

The approach is consistent with Frasers Group’s history of acquiring distressed retailers and attempting to restructure them.

Frasers Group previously acquired House of Fraser out of administration, closing at least 28 of its 59 stores as it reorganized its business. According to the BBC, the company also reported a £150 million ($203 million) loss on its investment in Debenhams, which entered administration in 2019.

The group acquired Matches Fashion in December 2023, The Guardian reported, but the online luxury retailer entered administration just three months later.

That history adds an additional layer of uncertainty to the Harvey Nichols acquisition. Frasers Group has experience in restructuring distressed retailers, but Harvey Nichols presents a different challenge because its value is closely tied to its luxury positioning, customer base, and physical stores.

The broader luxury market has also become more challenging. Luxury retailers have faced weaker consumer spending, changing shopping habits, higher costs, and a slowdown in international demand, putting pressure on businesses that once benefited from strong post-pandemic spending.

According to the McKinsey & Company State of Fashion 2026 Report, the global fashion industry is projected to grow at a low single-digit rate in 2026 amid macroeconomic volatility, tariff pressures, and weaker consumer sentiment.

Frasers Group believes its existing luxury portfolio and retail expertise can provide Harvey Nichols with a platform for a turnaround. But the company’s own warning that the business may need to become smaller underscores the scale of the challenges.

For Harvey Nichols, the acquisition marks the end of one era and the beginning of another. The retailer has avoided an immediate shutdown, but its next chapter will likely involve significant changes as Frasers Group decides which stores, operations, and investments can support the business for the long term.

Related: Sportswear giant continues store closures nationwide

Vanguard brought T. Rowe Price Associates on board to manage portions of Vanguard Explorer, Vanguard Growth and Income, and the Vanguard Variable Insurance Fund Small Company Growth Portfolio.

It is the first time T. Rowe Price has advised Vanguard, and the three funds together hold more than $42 billion in combined net assets, based on the funds’ most recent product data.

The change goes beyond adding a new manager, because Explorer is also moving further toward growth stocks. This gives shareholders another reason to pay attention to how the fund’s portfolio and risk profile develop from here.

Three Vanguard funds got new managers but the same mandates

Vanguard removed ArrowMark Colorado Holdings from Explorer and VVIF Small Company Growth, while Los Angeles Capital Management exited Growth and Income, Vanguard confirmed in a June 29 2026 announcement. 

T. Rowe Price received individual sleeves of each portfolio, not control of the entire fund.

As of mid-2026, Explorer held roughly $22.1 billion in net assets, Growth and Income held about $18.8 billion, and VVIF Small Company Growth held roughly $1.4 billion, according to Vanguard product data

Each fund retains its existing investment objective and principal strategy. Vanguard also adjusted Explorer’s adviser allocations to increase exposure toward the growth investment style. 

That shift received little attention in early coverage, but it may offer more weight for shareholders than the T. Rowe brand name itself, Vanguard’s announcement noted.

T. Rowe Price’s approach still relies on quantitative tools

Early headlines framed the deal as Vanguard swapping algorithms for human judgment. Jeff DeMaso, publisher of The Independent Vanguard Adviser, called the partnership “unthinkable” in comments to RIABiz and said Vanguard’s quantitative subadvisors had failed to deliver.

That framing doesn’t match the fund documents, which show that only one of the two departing advisers, Los Angeles Capital, used a quantitative model. 

ArrowMark’s process centered on fundamental company research, according to Vanguard’s prospectus filings.

D.E. Shaw continues to manage a quantitative sleeve of Growth and Income, and Vanguard’s own Quantitative Equity Group retains a sleeve of VVIF Small Company Growth.

More Vanguard:

T. Rowe Price uses a hybrid approach, for Explorer and VVIF Small Company Growth, the firm combines fundamental company research with quantitative models.

Those models score securities on growth, momentum, quality, and value characteristics, Vanguard’s June 29 2026 press release stated.

David Corris and Prashant Jeyaganesh, T. Rowe Price’s Integrated Equity co-portfolio managers, are running the strategy applied to Explorer and VVIF Small Company Growth.

Corris described the approach as pairing an “inside view” from fundamental research with an “outside view” from quantitative research.

For Growth and Income, T. Rowe uses analyst-driven stock selection constrained by rule-based portfolio construction and sector-level risk controls, the prospectus supplement confirmed.

Vanguard’s T. Rowe Price partnership blends quantitative models with fundamental research, showing that algorithms remain central to its investment approach.

Spencer Platt / Getty Images

Vanguard has not confirmed performance was the sole trigger

Vanguard evaluates outside managers on investment philosophy, team stability, performance history, risk characteristics, and capacity, the company stated in its June 29, 2026 release

No public filing reviewed identifies a single reason for either manager’s removal. Los Angeles Capital had co-managed a Growth and Income sleeve since 2011, handling roughly one-third of the fund’s assets, Morningstar estimated

ArrowMark’s portfolio managers had been involved with Explorer since 2014, Vanguard’s prospectus supplement shows. 

Fees rise modestly on two of the three funds

Growth and Income’s expense ratio rises by one basis point, from 0.39% to 0.40% for Investor shares and 0.28% to 0.29% for Admiral shares. That translates to about $1 more per year for every $10,000 invested, Vanguard’s prospectus supplement confirmed.

VVIF Small Company Growth sees a three-basis-point increase, from 0.29% to 0.32%, or roughly $3 per $10,000, and explorer’s expense ratio is unchanged.

VVIF’s expense ratio does not include separate annuity or life-insurance program charges, which Vanguard warns can raise the total cost further, the prospectus stated.

The real test for Vanguard’s T. Rowe Price bet will take years

T. Rowe Price’s adviser compensation on Growth and Income is tied to a 36-month rolling performance window measured against the S&P 500, the prospectus disclosed.

Jeff DeMaso, publisher of The Independent Vanguard Adviser, told RIABiz that mutual competitive pressures drove two longtime rivals into an unlikely alliance.

The interesting question is what this partnership says about the industry…T. Rowe Price and Vanguard have been direct competitors for decades. The fact that they’re working together now reflects pressure on both sides

Short-term returns won’t reveal much because these funds split their assets across multiple managers.

When one manager is swapped out, the portfolio needs time to settle. Early performance numbers are more likely to reflect the changeover itself than the new manager’s skill.

Vanguard’s strategy points to four things shareholders can track: future holdings disclosures, Explorer’s evolving style-box characteristics, tracking error against each fund’s benchmark, and updated expense ratios.

The portfolio changes extend beyond a manager replacement

For holders of Explorer, Growth and Income, and VVIF Small Company Growth, the key issue is how T. Rowe Price’s addition changes each fund’s underlying holdings, exposures, and investment profile. 

Explorer’s tilt toward growth is the change most likely to reshape returns, even without a fee increase. Growth and Income and VVIF holders will pay one and three basis points more, respectively. 

The open questions the fund documents don’t answer: how far Explorer’s style box moves, whether tracking error widens against each benchmark, and when the first post-transition holdings disclosure lands.

Related: Vanguard’s global ETF fixes the S&P 500’s biggest weakness

There is a version of the AI trade that everyone can see. Nvidia sells chips. Hyperscalers buy chips. The money flows one direction. It’s a clean story.

The SEC filing Nvidia dropped on August 14 tells a different version of that story, one where the chip supplier is also one of the largest shareholders in its own customer.

The number in the filing is not small. And the way Nvidia ended up with that position is worth understanding before investors decide what to make of it.

Nvidia NVDA discloses $21 billion SpaceX SPCX stake in SEC 13F filing

Nvidia disclosed owning 122.8 million Class A shares of SpaceX in a 13F filing with the Securities and Exchange Commission on August 14, according to CNBC. At SpaceX’s June 30 closing price of $170.86, the position was worth approximately $21 billion. That makes it Nvidia’s second-largest disclosed equity holding behind Intel.

More SpaceX:

SpaceX shares closed at $140 on August 14, pulling the value of Nvidia’s stake down to roughly $17.2 billion. That decline reflects the volatility SpaceX has experienced since its Nasdaq debut in June.

Nvidia is up nearly 20% in 2026. SpaceX has lost close to 7% since entering the public market in June. The two companies are moving in different directions as public equities even as their business relationship keeps deepening.

How Nvidia got 122.8 million SpaceX shares through xAI and Elon Musk

Nvidia never bought a single SpaceX share on the open market. In January 2026, it put $10 billion into xAI as part of a larger $20 billion funding round. Then in February, SpaceX bought xAI in an all-stock deal worth $1.25 trillion. Every xAI share became a SpaceX share. Nvidia’s stake came along with it, according to Bloomberg. A chip investment became a rocket investment without Nvidia ever placing a market order.

The Intel position is different. Nvidia announced a $5 billion strategic investment in Intel in September 2025. The deal closed on December 26, 2025, after FTC clearance, with Nvidia buying 214.7 million Intel shares at $23.28 per share. By June 30 that stake was worth $30 billion. By August 14 it had slipped to $22 billion, after Intel completed a $20 billion secondary offering on August 12 that pressured the stock. Still a remarkable return in under six months from the December closing, but down sharply from the peak.

Nvidia ranks sixth among SpaceX’s largest investors, based on FactSet data. Musk holds the top spot with a stake worth roughly $850 billion. Alphabet is second at approximately $78 billion, according to CNBC.

The bigger question for Nvidia shareholders isn’t the short-term stock price

Reginald/Getty Images

Nvidia circular investment risk and what it means for NVDA shareholders

Nvidia now supplies AI chips to SpaceX, holds a large equity stake in SpaceX, and profits if SpaceX’s AI buildout drives more hardware demand. All three things happen simultaneously.

That creates a layered exposure for Nvidia shareholders. Chip revenue from SpaceX. Equity upside if SpaceX grows. And if the AI infrastructure trade reverses, both decline at the same time.

Musk made the hardware commitment explicit during SpaceX’s second-quarter earnings call. The company will build its AI data centers exclusively on Nvidia chips. SpaceX expects a significant allocation of Vera Rubin processors next year, making it one of Nvidia’s most important customers at the exact moment Nvidia is one of SpaceX’s largest outside investors, as TheStreet reported.

Nvidia is not alone in this pattern. Microsoft backs OpenAI. Amazon backs Anthropic. The Bank for International Settlements has flagged this kind of arrangement as a systemic concern worth watching. Together Nvidia’s SpaceX and Intel positions represent roughly $39 billion in disclosed equity holdings, more than 80% of its total disclosed portfolio.

What Nvidia’s SpaceX stake means for NVDA stock investors in 2026

The value of Nvidia’s SpaceX position moves with SPCX stock, which has been volatile since the June IPO. More shares are still set to unlock. A staggered nine-part schedule means additional tranches keep coming. A window opened August 20 with as many as 319 million shares potentially eligible for sale.

The bigger question for Nvidia shareholders isn’t the short-term stock price. It’s whether SpaceX follows through on buying Vera Rubin chips at scale.

If that relationship produces hundreds of billions in hardware orders over the next few years, the $10 billion xAI bet that started the whole chain looks like one of Nvidia’s best deals ever. If SpaceX’s AI ambitions take longer than expected, Nvidia absorbs both the equity loss and the demand shortfall at once.

For now the filing put something in writing that the market had suspected. Nvidia is not just selling AI infrastructure. It is increasingly embedded inside the companies building it.

Related: Morgan Stanley sends blunt SpaceX message to investors

Trading stocks through Schwab no longer necessarily requires buying a company’s shares outright, opening a new way with significantly less cash up front.

The product is called a single stock future, and it comes with a track record that the marketing materials skip over entirely.

Charles Schwab Futures & Forex launched the contracts on more than 50 U.S. equities on August 12, 2026, covering the S&P 500, Nasdaq-100 and Russell 1000. 

Schwab describes it as a simpler, cheaper alternative to options for traders who want leveraged exposure to popular S&P 500 and Nasdaq-100 names like Apple, Nvidia, Tesla, and Amazon.

Lower margin requirements, no borrow fees for short positions, and nearly round-the-clock trading access sit at the top of the pitch.

The catch is that this exact product already existed in U.S. markets, attracted almost no interest, and disappeared by September 2020.

How Schwab’s single stock futures give traders more leverage

Schwab’s contracts trade on the Chicago Mercantile Exchange and let investors go long or short on individual stocks without owning shares, the company confirmed.

Each standard contract represents 100 shares, and micro contracts covering 10 shares are available for traders who want smaller positions in expensive names. 

The commission runs $2.25 per contract per side, plus exchange and regulatory fees, and only futures-approved accounts qualify, Schwab’s pricing page confirmed.

The margin structure sets these contracts apart from traditional stock purchases and gives traders considerably more leverage with their capital. 

Under federal Regulation T, buying stocks on margin requires about 50% of the position’s notional value in cash up front, the Code of Federal Regulations showed.

Single stock futures require a minimum initial margin of just 15%, a threshold that federal securities and commodities regulators jointly finalized in 2020, according to the U.S. Securities and Exchange Commission

That difference between the 50% Regulation T requirement and the 15% futures margin substantially alters the capital math for anyone considering leveraged stock exposure through a futures account at Schwab. 

For a stock trading at $200, a trader could control 100 shares by posting about $3,000 instead of $10,000 under standard margin.

This product already failed once in U.S. markets

Congress legalized futures on individual stocks through the Commodity Futures Modernization Act of 2000, and two exchanges (Nasdaq Liffe Markets and OneChicago) launched the contracts in November 2002, as cited by the New York Times.

High margin requirements, thin liquidity, and limited broker participation kept retail adoption of the original contracts close to zero throughout their entire lifespan. 

More Charles Schwab:

CME Chairman and Chief Executive Officer Terry Duffy was blunt about the record during the exchange’s second-quarter earnings call on July 22, 2026.

“When we introduced them the first time, they failed miserably,” Duffy told analysts, Fortune reported. “The world has evolved since 2000.”

CME relaunched the contracts on July 27, 2026, with over 35 retail partners aiming day-one readiness, Morgan Stanley analyst Michael Cyprys wrote in a research note reported by CNBC. 

Single-stock futures failed in U.S. markets before, but CME’s 2026 relaunch aims to overcome liquidity and retail adoption challenges.

Xinhua News Agency / Getty Images

Leverage and risk cut both ways for Schwab’s retail traders

The simplified structure that makes these contracts appealing to newer traders also concentrates risk in ways that deserve careful examination. 

Schwab’s disclosures warn that leveraged futures positions can produce losses exceeding the initial margin deposit, the company’s product page confirmed. 

Futures accounts also have no coverage from the Securities Investor Protection Corporation, a safeguard that standard brokerage accounts typically provide.

Mat Cashman, principal for investor education at the Options Clearing Corp., warned that off-hours trading around earnings announcements tends to produce volatile pricing, Fortune reported

Unlike commission-free stock and options platforms at most retail brokerages, every futures trade here adds per-contract fees that raise round-trip costs.

Schwab is pushing hard on a product with a checkered past

Schwab reported $13.08 trillion in total client assets and a record 11.9 million daily average trades during the second quarter of 2026, its July 21, 2026, earnings release confirmed.

James Kostulias, Managing Director and Head of Trading Services at Charles Schwab, said the addition of single stock futures broadens the firm’s trading lineup and reinforces its appeal to retail traders.

Adding Single Stock Futures expands the breadth of our trading offering and strengthens our position as a destination for retail traders

Index futures already represent about 75% of Schwab’s futures trading volume, Kostulias said in the August 12 announcement, and single stock futures extend that franchise to individual companies.

What the margin math means for a trading account

Schwab’s product disclosures describe the leverage embedded in these contracts as a significant risk factor distinct from owning shares outright. 

A 15% initial margin translates to controlling roughly 6.7 times the cash deposit, based on CME’s margin structure disclosed at contract launch. 

Every $1 move in the underlying stock produces a $100 gain or loss on each standard contract, which sets the standard multiplier at 100 shares, according to the CME’s contract specifications.

A 15% decline in the stock can wipe out the entire initial margin in a single session under those leverage conditions. 

Schwab’s risk disclosures highlight two dimensions of the product’s risk profile: the drawdown a leveraged position can produce during 23-hour trading, and how total round-trip futures costs compare with buying or shorting the same shares through a standard brokerage account.

Related: Schwab warns of 5 money traps risking savings, investments

Warren Buffett‘sBerkshire Hathaway made a move that caught even longtime investors off guard. 

The conglomerate first built a new position in Macy’s in Q1 of 2026, marking its first public bet on a department store chain in about 60 years. 

According to Tikr.com data

  • Berkshire now holds 7.37 million shares of Macy’s (M) worth roughly $173 million, according to filing data.
  • That stake grew 141.82% during the period covered by the filing, giving Berkshire 2.79% ownership of Macy’s outstanding shares as of June 29, 2026.
  • It’s a small position relative to Berkshire’s overall portfolio, representing just 0.06% of total holdings. 

Buffett has generally avoided traditional retailers for several years, and this shift suggests someone at Berkshire sees real value sitting inside Macy’s stock right now.

Berkshire avoided department stores for decades

Berkshire’s relationship with department stores goes back to the 1960s, when Buffett and longtime partner Charlie Munger invested in Hochschild Kohn, a Baltimore-based chain. 

That bet didn’t work out, and Buffett later became known for avoiding retailers facing structural headwinds like e-commerce competition and shrinking mall traffic.

Buffett isn’t making the call, since Berkshire’s stock picks in recent years have often come from other portfolio managers. 

More Warren Buffett:

Still, any new retail bet from Berkshire tends to draw attention given the firm’s track record of avoiding value traps.

Macy’s operates through three brands:

  • Macy’s is the classic department store chain, selling apparel, cosmetics, and home goods across the middle-to-upper price range. 
  • Bloomingdale’s is the luxury arm, known for high-end fashion and a more elevated shopping experience. 
  • Bluemercury rounds things out as a specialty beauty and skincare retailer.

Combined, the company carries a market cap of around $6.2 billion.

Macy’s stock delivered a strong quarter

The timing of Berkshire’s stake lines up with a strong quarter for Macy’s. During its first-quarter 2026 earnings call, CEO Tony Spring told investors:

“In the first quarter, we delivered enterprise-wide growth, better than expected performance across all key metrics. And our best comparable sales in four years with all nameplates and channels positive.” 

Companywide comparable sales rose 3%, well above the company’s own guidance of 0.5% to 1.5%. 

Related: Warren Buffett has a stark message for stock market investors

Adjusted earnings per share came in at $0.13, beating a guidance range that topped out at a penny of profit. Net sales climbed 1.8% to $4.7 billion, also ahead of expectations.

Macy’s nameplate posted its fourth straight quarter of positive comps, up 1.6%. Bloomingdale’s posted a 10.2% comp gain, the best first-quarter sales result in its 154-year history. Bluemercury grew comparable sales 6.4%.

CFO Tom Edwards said operating cash flow swung to a $292 million inflow, compared to a $64 million outflow a year earlier. 

Chief Executive Officer Macy’s Tony Spring is optimistic about turnaround plans

Dave Kotinsky/Getty Images

The Reimagine stores are key growth drivers

Much of the improvement traces back to what Macy’s calls its Reimagine program, a set of upgraded stores with more staffing, better assortments, and improved visual presentation. 

Spring said these locations have posted positive comps in eight of the last nine quarters and now cover about 60% of Macy’s go-forward store base.

Management also pointed to steady growth in average unit retail, which was up 8.3% companywide, alongside consistent customer traffic.

Executives attributed part of that gain to selling more premium products and less clearance merchandise than a year earlier.

Not everything is firing on all cylinders.

Big-ticket furniture and the plus-size category both showed softness, something Spring attributed partly to tariff-related price increases and a soft housing market.

What the raised guidance tells investors

Macy’s raised its full-year outlook following the quarter, now expecting net sales between $21.5 billion and $21.75 billion, with adjusted earnings per share of $2.00 to $2.20. 

The company also returned $100 million to shareholders in the quarter through dividends and buybacks, with about $1.1 billion still left on its repurchase authorization.

For a stock trading at a roughly $6.2 billion market cap against $21.5 billion or more in expected annual revenue, the valuation gap is hard to ignore. 

Analysts tracking the retail stock forecast free cash flow to expand from $690 million in fiscal 2026 to $955 million in fiscal 2031, given consensus forecasts from Tikr.com.

If the stock is priced at 8.3x forward FCF, similar to its current multiple, it could return over 35% within the next three years, after adjusting for dividends. 

Out of the 10 analysts covering Macy’s stock, one recommends “Buy”, eight recommend “Hold”, and one recommends “Sell”. The average Macy’s stock price target is $22.33, which is 4.6% below current levels. 

Whether this stake grows into something larger remains to be seen. Berkshire’s position is still tiny relative to its overall book. 

But for a firm that has stayed away from department stores since the Hochschild Kohn days, even a modest bet on Macy’s stock is worth watching closely.

Related: Warren Buffett’s Berkshire raises stake in world’s largest airline