Author

admin

Browsing

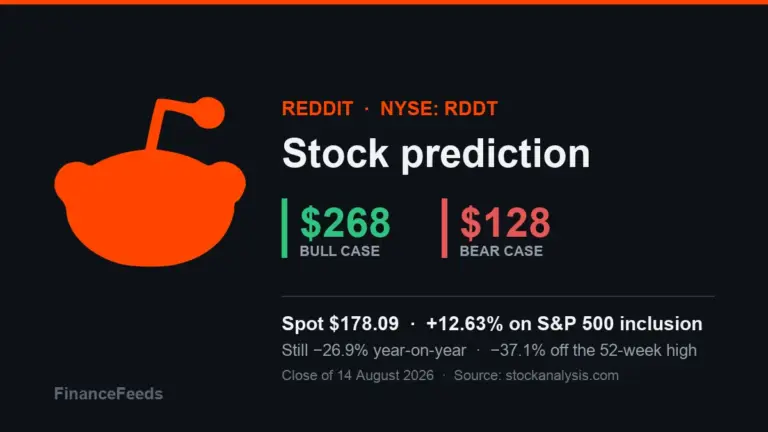
Index inclusion is not a re-rating. Reddit (RDDT) closed at $178.09 on August 14, 2026, up 12.63% on the session that confirmed its entry into the S&P 500 — and still 26.9% below where it traded twelve months earlier, and 37.1% below its 52-week high of $282.95 (stockanalysis.com daily close, retrieved August 15, 2026). Those two facts sit awkwardly together, and reconciling them is the whole job of this article. The pop is a mechanical, one-off flow event: passive funds tracking the index are obliged to buy, they buy once, and then that bid is gone. What it does not do is answer the question the market has been asking Reddit all year — which is not whether the company can grow, but whether the traffic underneath the growth belongs to Reddit at all.

That distinction is where this piece departs from the standard inclusion write-up. Reddit’s Q2 2026 was not a bad quarter; it was an excellent one. Revenue landed at $805 million, up 61% year on year, against roughly $730 million expected. Net income of $253 million was up 184% from $89 million. Diluted earnings per share of $1.25 beat an expectation near $0.95. Daily active users reached 130.3 million, up 18%, with international up 28%. The stock fell 9% anyway. A company does not beat on every line and lose a tenth of its value because investors dislike the numbers. It happens because investors have stopped believing the numbers are durable — and the mechanism behind that doubt is Google. Index inclusion changes Reddit’s shareholder register. It does not change its traffic dependency.

Reddit (RDDT) one-year daily close. Source: stockanalysis.com, retrieved August 15, 2026.

Key facts

  • Spot price $178.09, close of August 14, 2026, +12.63% on the day — stockanalysis.com, retrieved August 15, 2026
  • One year earlier (August 14, 2025) the stock closed at $243.47 — a 26.9% decline over twelve months
  • 52-week high $282.95 (September 18, 2025); 52-week low $119.27 (March 30, 2026)
  • Q2 2026 revenue $805 million, up 61% year on year; advertising revenue $762 million, up 64%
  • Q2 2026 net income $253 million, up 184% from $89 million; diluted EPS $1.25
  • Global daily active users 130.3 million, up 18%; international DAU up 28%
  • Q3 2026 revenue guidance $860–870 million

What the S&P 500 addition actually does

Addition to the S&P 500 triggers a specific, well-understood sequence. Index funds and ETFs benchmarked to the index must hold the constituent in its index weight, and they must establish that position around the effective date. That produces concentrated, price-insensitive demand over a short window — which is exactly what a 12.63% single-session move looks like. FinanceFeeds covered the mechanics of the addition and the accompanying index changes in its report on Reddit joining the S&P 500.

The part that gets lost is what happens next. The passive bid is a stock adjustment, not a flow: once trackers hold their weight, ongoing buying reverts to whatever net creations the funds themselves see. There is a second, more durable effect — index membership widens the eligible buyer base, since some mandates can only hold index constituents, and it typically improves liquidity and lowers the cost of capital at the margin. Those are real. They are also slow, and they are worth a good deal less than 12.63%.

The honest framing, then, is that inclusion has moved Reddit’s share price without moving Reddit’s business. Anyone underwriting the stock at $178.09 on the strength of the index news is paying a premium created by forced buyers to acquire an asset whose fundamental question is entirely unresolved.

The de-rating nobody has reversed

Reddit lost 26.9% over a year in which revenue grew 61% and net income nearly tripled. That is a multiple compression of considerable violence, and it has a specific cause. In the Q2 2026 shareholder letter, the company wrote that “search referrals were choppy in the quarter, and traffic was more volatile later in the quarter.” That sentence is the reason the stock fell 9% on a quarter it comprehensively beat.

Reddit’s user growth has been substantially driven by users arriving from Google search. That is a commercially excellent arrangement while it lasts and an existential dependency when it wobbles. Google controls the referral volume, Google is reshaping its results pages around AI-generated answers that satisfy queries without a click-through, and Google is simultaneously a customer — it licenses Reddit’s corpus for model training. Reddit is thus exposed to the same counterparty as a supplier, a distributor and a competitor at once. FinanceFeeds examined this dynamic in detail in its analysis of why Reddit grew 61% and fell anyway.

This is the analytical crux. A business whose customer acquisition is controlled by a third party does not deserve the multiple of a business that owns its own demand, however fast it is growing. The market applied that discount over the past year. Index inclusion does not lift it, because index funds do not price securities — they hold whatever the committee tells them to hold, at whatever price the market sets.

Reading the twelve-month range

The 52-week range is unusually informative here. Reddit traded as high as $282.95 on September 18, 2025 and as low as $119.27 on March 30, 2026 — a spread of 2.37x within a single year. That is not the price action of a business with a settled valuation; it is a market that cannot agree on what the asset is. The high embeds a view of Reddit as a structurally advantaged social platform with a unique, human-generated data moat. The low embeds a view of it as a traffic reseller whose supply line runs through a competitor’s product decisions.

At $178.09 the stock sits roughly in the middle — 37.1% below the high, 49.3% above the low. Neither camp has won. What the March low establishes, though, is that the market has already demonstrated its willingness to price the bear case, and recently. That matters when setting a downside target: $119.27 is not a hypothetical, it is a level this stock printed less than five months ago.

The monetisation math the headline numbers hide

Combining the two disclosures Reddit made for Q2 2026 produces a figure the company does not report directly. Revenue of $805 million against 130.3 million global daily active users implies quarterly revenue per daily active user of roughly $6.18, or approximately $24.70 annualised. That calculation is ours, derived from the reported revenue and DAU figures rather than disclosed by Reddit, and it is the single most useful number for judging which of the two cases below is more likely.

It matters because it separates the two engines of growth. Revenue rose 61% year on year while daily active users rose 18%. Arithmetically, the majority of Reddit’s growth is therefore coming from monetising existing users harder, not from adding new ones. That is the opposite of the assumption embedded in the bear case, which worries about the user input flattening.

Read one way, this is reassuring: if most growth is monetisation-driven, a slowdown in Google referrals damages Reddit less than the headline dependency suggests, because the company is extracting more from the audience it already has. Read the other way, it is a warning: monetisation-led growth has a ceiling that user-led growth does not, since advertising load per user cannot rise indefinitely without degrading the product that attracts the users in the first place. Every social platform that has pushed this lever too hard has discovered where the limit sits.

The resolution depends on where Reddit currently sits on that curve, and $24.70 of annualised revenue per daily active user is not obviously stretched against larger advertising platforms with more mature ad stacks. That leaves room to run. But it also means the next several quarters of growth are likely to lean further on the same lever, which makes the eventual deceleration a question of when rather than whether — and makes the durability of the user base, not the ad business, the thing worth watching.

Bull case: $268

The bull case does not require anything exotic. It requires that the search-referral concern proves cyclical rather than structural, and that Reddit’s advertising business continues converting attention at the rate Q2 demonstrated. On the numbers already reported, that is not a stretch. Advertising revenue of $762 million growing 64% year on year, with net income up 184%, is a business demonstrating real operating leverage — costs are not growing with revenue, which is the signature of a platform reaching scale.

Q3 guidance of $860–870 million implies continued sequential growth from a Q2 that already beat. If Reddit delivers against that and the traffic commentary stabilises, the multiple compression of the past year reverses mechanically, because nothing else about the business has deteriorated. A return to the 52-week high region of $282.95 would represent a re-rating to where the market valued this same company, on smaller revenue, eleven months ago.

A target of $268 — approximately 50% above spot and modestly below the prior high — reflects that recovery without assuming the stock reclaims its most optimistic valuation outright. It also gains support from the widened buyer base that index membership genuinely does confer, and from the international DAU growth of 28%, which is the part of the user base least dependent on English-language Google search.

Bear case: $128

The bear case needs nothing to go wrong. It only needs the search-referral pressure to persist. If Google’s AI-generated answers continue to satisfy queries that previously produced a click through to a Reddit thread, then Reddit’s daily active user growth decelerates regardless of how well the company executes on advertising. Revenue growth of 61% is not a permanent state; it is a function of users multiplied by monetisation, and if the user input flattens, the whole equation resets.

The company’s own language — “search referrals were choppy,” “traffic was more volatile later in the quarter” — is not the language of a business confident in its distribution. Read plainly, it is a warning delivered in the mildest available terms. Markets punished it accordingly.

A target of $128 represents roughly 28% downside from spot and sits just above the March 30 low of $119.27. That is deliberate: the bear case here is not a crash to a new low, it is a return to a level the market has already tested this year once the index-driven bid has been absorbed. If Q3 traffic commentary echoes Q2’s, that retest is the path of least resistance.

What would change the view

Three observable signals would settle this in one direction or the other. First, the Q3 shareholder letter’s language on search referrals: an unambiguous statement that referral volume has stabilised removes the central bear pillar, while a repeat of the “choppy” formulation confirms it. Second, daily active user growth: 18% is healthy, but the sequential trend matters more than the year-on-year rate, and a deceleration toward low double digits would signal the referral effect is biting. Third, the durability of the post-inclusion price: if the stock holds above $170 a month after the effective date, the index bid has been absorbed without a round-trip; if it fades back toward $150, the pop was purely mechanical and the market’s underlying assessment is unchanged.

Reddit’s monetisation is not in doubt. Its ownership of its own audience is. Until that resolves, index membership is a change of shareholder, not a change of thesis. Readers tracking adjacent index and prediction-market dynamics may find FinanceFeeds’ coverage of the previous bull and bear case on Reddit a useful comparison, given how much has changed in ten days.

Frequently asked questions

Why did Reddit stock jump on S&P 500 inclusion?

Index funds and ETFs benchmarked to the S&P 500 are required to hold every constituent at its index weight. That creates concentrated, price-insensitive buying around the effective date. Reddit rose 12.63% to $178.09 on August 14, 2026 on that mechanical demand rather than on any change to its business.

Is Reddit stock up or down over the past year?

Down. Reddit closed at $243.47 on August 14, 2025 and at $178.09 on August 14, 2026, a decline of 26.9%, despite revenue growing 61% year on year in Q2 2026. The stock is 37.1% below its 52-week high of $282.95.

Why did Reddit fall after beating earnings?

Reddit beat on revenue and earnings in Q2 2026 but fell around 9%. The company noted in its shareholder letter that “search referrals were choppy in the quarter, and traffic was more volatile later in the quarter.” Investors read that as a threat to the Google-driven user growth underpinning the model.

What are the bull and bear targets for RDDT?

This analysis sets a bull case of $268, roughly 50% above the $178.09 spot, requiring search-referral pressure to prove cyclical and Q3 guidance of $860–870 million to be met. The bear case is $128, about 28% below spot, just above the March 30, 2026 low of $119.27.

Does index inclusion make a stock a better investment?

Not by itself. Inclusion widens the eligible buyer base and can modestly improve liquidity and cost of capital, which are real but slow effects. The immediate price move reflects one-off forced buying by trackers. It carries no information about the underlying business.

This article is informational analysis only and is not financial, investment, or trading advice. Equity markets are volatile and prices can fall as well as rise. Past performance does not guarantee future results. Do your own research and consult a regulated financial adviser before making any investment decision.
A 184% year does not make a stock cheap or expensive — it changes what the bull case has to prove. AMD closed at $514.39 on August 14, 2026, up 6.5% on the session, having traded at $180.95 twelve months earlier (stockanalysis.com daily close, retrieved August 15, 2026). It also sits 12.0% below its 52-week high of $584.73, set on June 30, 2026. The useful question at this price is not whether AI demand is real — that debate is over, and the numbers settled it. It is whether the rate of change in AMD’s data-centre share gains can keep pace with a valuation that already assumes they continue.

Here is the asymmetry that framing exposes, and it is the reason this piece reaches a different conclusion from the standard AI-semiconductor write-up. The bull case requires something to keep accelerating. The bear case requires nothing to go wrong at all — it only requires deceleration. In Q2 2026, AMD’s Data Center segment supplied roughly 90% of the company’s entire year-on-year revenue growth. A business whose growth is that concentrated in one segment is not diversified against a slowdown in that segment; it is a single-variable bet wearing a diversified income statement. That concentration is the whole risk, and it is not visible in the headline 50% revenue growth.

AMD one-year daily close. Source: stockanalysis.com, retrieved August 15, 2026.

Key facts

  • Spot price $514.39, close of August 14, 2026, +6.5% on the day — stockanalysis.com, retrieved August 15, 2026
  • One year earlier (August 14, 2025) the stock closed at $180.95 — a gain of 184.3%
  • 52-week high $584.73 (June 30, 2026); 52-week low $149.22 (September 8, 2025) — a 3.9x spread inside one year
  • Q2 2026 revenue $11.5 billion, up 50% year on year
  • Q2 2026 Data Center revenue $6.7 billion, up 107%58% of company revenue and roughly 90% of total growth
  • Client and Gaming $3.8 billion (up 6%); Embedded $977 million (up 19%)
  • Non-GAAP EPS $1.66 against consensus of $1.62; non-GAAP gross margin 56%
  • Q3 2026 guidance approximately $13 billion ±$300 million — 41% year on year, 13% sequential

What the segment split actually says

AMD’s Q2 2026 was, on its face, a straightforward beat. Revenue of $11.5 billion grew 50%, non-GAAP earnings per share of $1.66 edged consensus of $1.62, and non-GAAP gross margin held at 56%. Chair and Chief Executive Lisa Su described it as “an excellent quarter, with record revenue and profitability as Data Center revenue more than doubled year-over-year.”

The segment detail is where the analysis gets interesting. Data Center delivered $6.7 billion, up 107%. Client and Gaming delivered $3.8 billion, up 6%. Embedded delivered $977 million, up 19%. Put differently: two of AMD’s three segments grew at rates that would be unremarkable for a mature semiconductor business, and one grew at a rate that would be remarkable for anything.

That is not a criticism — capturing a doubling market is exactly what a company should do. But it does mean the consolidated growth rate is close to meaningless as a forward indicator. The 50% figure blends a segment compounding at triple digits with segments barely growing. Model the segments separately and the picture sharpens considerably: AMD’s valuation is a function of Data Center, and Data Center alone.

The customer concentration underneath the customer wins

AMD has converted its Instinct accelerator line into genuinely large commitments. Meta has committed to up to six gigawatts of Instinct GPUs. Anthropic has signed a two-gigawatt agreement worth up to $5 billion. These are real, named, multi-year commitments from counterparties with the balance sheets to honour them, and they are the strongest evidence available that AMD has broken into a market Nvidia defined.

The counter-evidence is equally specific. SpaceX committed exclusively to Nvidia’s Vera Rubin architecture for its AI data centres. That single decision illustrates the structural point: at the frontier of AI training, architecture choices are made once and then locked in for years, and AMD is not winning all of them. FinanceFeeds set out the fuller competitive picture in its earlier AMD forecast, and the contrast with the Nvidia bull and bear case is instructive on how differently the market prices the incumbent and the challenger.

A handful of hyperscale customers accounting for a large share of a segment that supplies 90% of company growth is a concentration risk stacked on a concentration risk. It does not make the thesis wrong. It does mean the distribution of outcomes is wider than a 50%-growth headline implies, which is precisely what the stock’s 3.9x twelve-month range has been telling anyone reading it.

What the analysts said, and when

As of early August 2026, the sell-side targets on record were clustered meaningfully above the then-prevailing price. Jefferies analyst Blayne Curtis raised his target to $650 from $640 with a Buy rating. Truist’s William Stein raised to $594 from $478. The street average sat at $597.99. Those figures were compiled when AMD traded at $482.05 on August 5, 2026, with a market capitalisation of $786.93 billion, a trailing price/earnings ratio of 123.0x and a forward multiple of 43.7x.

Two caveats matter and are worth stating plainly rather than burying. First, those targets are dated: the stock has since risen 6.7% to $514.39, which mechanically compresses the implied upside to the street average from roughly 24% to about 16%. Second, this article does not have a verified analyst revision published in the last 24 hours; the targets above are the most recent we can source and date precisely, and they are reported as of early August rather than as today’s view. Where a number cannot be dated to a specific published note, it does not appear here.

The valuation arithmetic at $514

Applying the August 5 market capitalisation of $786.93 billion to the move since then implies a market value of approximately $840 billion at the August 14 close — a figure derived from the price change rather than separately disclosed. Against Q3 guidance of roughly $13 billion in quarterly revenue, an annualised run-rate near $52 billion puts the business on something close to 16x forward sales.

The forward earnings multiple of 43.7x recorded at $482.05 scales to roughly 47x at $514.39 on unchanged estimates. That is not obviously absurd for a company guiding to 41% year-on-year growth — a growth-adjusted reading is close to parity. It is, however, a multiple that requires the growth to persist for several years rather than several quarters, because at 47x forward earnings the terminal value assumption is doing most of the work.

This is the honest statement of the situation: AMD is not expensive relative to its current growth, and it is not cheap relative to any scenario in which that growth normalises. Both statements are true simultaneously, which is why the stock can move 3.9x inside a single year.

Why this stock moves 3.9x in a year

The 52-week range deserves its own treatment, because it is the most underused piece of information about AMD. The stock traded as low as $149.22 on September 8, 2025 and as high as $584.73 on June 30, 2026 — a spread of 3.9 times within twelve months. For a company with $11.5 billion of quarterly revenue and 56% gross margins, that is an extraordinary amount of disagreement about a business whose fundamentals were, throughout, improving.

The explanation is structural rather than emotional. When a company’s valuation depends on a terminal growth assumption, small revisions to that assumption produce large revisions to present value. A shift from “data-centre growth persists for five years” to “three years” does not change next quarter’s earnings at all, but it changes what those earnings are worth by a multiple. Every incremental data point — a hyperscaler commitment, a competitor design win, a guidance revision — moves the assumption, and the price moves by far more than the data point appears to warrant.

This has a practical consequence for anyone setting targets. Both the bull and bear cases below are drawn inside the range this stock has already traded in the past year, which is a deliberate discipline: neither requires the market to do anything it has not recently demonstrated it will do. The $770 bull case sits 32% above the June high and the $350 bear case sits 135% above the September low. Given the observed range, neither is a stretch — which is itself the clearest statement of how wide the distribution of outcomes remains.

Bull case: $770

The bull case rests on the sequential trajectory rather than the year-on-year one. Q3 guidance of approximately $13 billion implies 13% sequential growth on top of a Q2 that already grew 50% annually. Sequential acceleration of that order, sustained, compounds far faster than most models assume, and AMD’s non-GAAP gross margin holding at 56% while Data Center scales indicates the mix shift is not diluting profitability — which is the failure mode that usually accompanies rapid share gains.

If the Meta and Anthropic commitments convert to revenue on schedule, and if Instinct captures even a modest additional slice of accelerator spend, the Data Center segment alone could approach the size of today’s entire company within a reasonable planning horizon. A target of $770 — roughly 50% above spot and about 32% above the 52-week high — reflects that outcome. It requires no change in multiple, only delivery against the growth already guided, with the re-rating coming from earnings rather than from sentiment.

Bear case: $350

The bear case does not require AI spending to stop, a competitor to win, or AMD to stumble. It requires only that the rate of growth slows. At 47x forward earnings, a deceleration from 41% growth to, say, 20% would not halve the earnings — it would halve the multiple the market is willing to pay for them, and those two effects compound.

The mechanism is well established in semiconductors: hyperscale customers order in large, lumpy commitments, digest them, and pause. Six gigawatts of Meta commitments is a tremendous order and also a finite one. When the digestion phase arrives — and in every prior capital-expenditure cycle it has arrived — the segment supplying 90% of growth decelerates first and hardest.

A target of $350 represents approximately 32% downside from spot. It sits well above the 52-week low of $149.22, so it does not assume a collapse; it assumes a multiple reset toward the mid-20s on forward earnings while the business continues growing. That is a normalisation, not a disaster, and the stock’s own June-to-August drawdown of 12% suggests the market periodically entertains it.

The Client and Gaming problem

One segment deserves more attention than it usually gets. Client and Gaming grew 6% year on year to $3.8 billion in Q2 2026 — a third of company revenue growing at roughly the rate of the broader PC market. For most of AMD’s history this was the business, and its performance against Intel was the entire investment case.

Its relevance now is as a floor. A third of revenue growing slowly but reliably, at company gross margins, is what separates AMD from a pure-play accelerator business. In the bear scenario where data-centre growth decelerates sharply, Client and Gaming does not disappear; it continues generating cash and supporting the multiple from below. That is why the bear case here is a normalisation to $350 rather than a collapse toward the 52-week low.

What would settle it

Three signals, in order of information value. First, the Data Center sequential growth rate in Q3: guidance implies 13% company-wide, and if Data Center comes in materially below that, the concentration risk is already biting. Second, gross margin: 56% non-GAAP is the number to watch, because share gains bought with price concessions show up here before they show up anywhere else. Third, the composition of new commitments — whether AMD converts additional named hyperscalers or continues to deepen with the same few, since the latter increases revenue and concentration simultaneously.

For readers tracking the wider semiconductor complex, FinanceFeeds’ analyses of Intel and Arm cover the same cycle from two very different competitive positions.

Frequently asked questions

What is AMD’s stock price and how has it performed?

AMD closed at $514.39 on August 14, 2026, up 6.5% on the day. It has risen 184.3% from $180.95 twelve months earlier, but trades 12.0% below its 52-week high of $584.73 set on June 30, 2026.

How much of AMD’s growth comes from data centres?

In Q2 2026 the Data Center segment generated $6.7 billion of $11.5 billion total revenue, growing 107% year on year. It accounted for 58% of company revenue and approximately 90% of total year-on-year revenue growth, making consolidated growth largely a function of one segment.

What are analysts’ price targets for AMD?

As of early August 2026, Jefferies’ Blayne Curtis raised his target to $650 with a Buy rating, Truist’s William Stein raised to $594, and the street average stood at $597.99. Those targets were set when the stock traded at $482.05, so the implied upside has since compressed as the price rose to $514.39.

What are the bull and bear targets for AMD?

This analysis sets a bull case of $770, roughly 50% above the $514.39 spot, requiring the guided growth to be delivered without multiple expansion. The bear case is $350, about 32% below spot, requiring only a deceleration in data-centre growth and a corresponding multiple reset.

Is AMD expensive at current levels?

Both answers are defensible. The forward earnings multiple of 43.7x recorded at $482.05 scales to roughly 47x at $514.39, which is close to parity against guided growth of 41%. That is reasonable if growth persists for years and demanding if it normalises within quarters.

This article is informational analysis only and is not financial, investment, or trading advice. Equity markets are volatile and prices can fall as well as rise. Past performance does not guarantee future results. Do your own research and consult a regulated financial adviser before making any investment decision.
A stock that has risen 35-fold in a year cannot be analysed like a semiconductor company. SanDisk (SNDK) closed at $1,641.11 on August 14, 2026, up 7.39% on a session in which the entire memory complex moved together, having traded at $46.68 twelve months earlier — a gain of 3,415.7% (stockanalysis.com daily close, retrieved August 15, 2026). It is also 30.3% below its 52-week high of $2,354.39, set on June 22, 2026. Both of those facts describe the same twelve months, and holding them together is the only honest way to value this business.

Here is the detail that decides the case, and it is buried in the company’s own disclosure rather than in any headline. Of SanDisk’s sequential revenue growth in the most recent quarter, roughly two-thirds came from pricing and only one-third from volume. That single ratio reframes everything. A business growing on volume is taking share; a business growing on price is riding a shortage. Shortages end — not because the company does anything wrong, but because price is the mechanism by which supply is eventually summoned. The bear case for SanDisk does not require a single operational misstep. It requires only that NAND pricing normalises, and the company has already told us that pricing is doing most of the work.

SanDisk (SNDK) one-year daily close. Source: stockanalysis.com, retrieved August 15, 2026.

Key facts

  • Spot price $1,641.11, close of August 14, 2026, +7.39% on the day — stockanalysis.com, retrieved August 15, 2026
  • One year earlier (August 14, 2025) the stock closed at $46.68 — a gain of 3,415.7%
  • 52-week high $2,354.39 (June 22, 2026); 52-week low $42.82 (August 15, 2025)
  • Q4 FY2026 revenue $8.97 billion, up 372% year on year; adjusted EPS $39.25 against a $34.52 estimate
  • Q4 FY2026 gross margin 84.6% — a company record
  • Full-year FY2026 revenue $20.25 billion; net income $11.43 billion
  • Q1 FY2027 guidance $10.3–10.8 billion at 83–85% gross margin
  • Long-term contracts: approximately $93.9 billion of minimum commitments across 8 contracts with 6 customers on four-year terms

The sector move matters, and it cuts both ways

The 7.39% gain on August 14 was not a SanDisk event. The whole memory and storage complex rose together, and a sector-wide move is materially weaker evidence about any single company than a stock-specific one. When correlated names move in lockstep, the market is repricing a commodity — NAND — rather than reassessing a management team.

That distinction is worth holding onto, because it works in both directions. It means SanDisk’s gain that day tells you very little about SanDisk’s execution. It also means the 30.3% drawdown from the June high is not a verdict on SanDisk either. Both moves are the cycle talking. FinanceFeeds has tracked the same complex through Micron and Western Digital, the company from which SanDisk was separated, and the correlation across those names is the clearest available evidence that this is a commodity repricing rather than a set of independent company stories.

What the Investor Day actually established

SanDisk’s Investor Day produced the most specific forward guidance the company has given. Chief Financial Officer Luis Visoso put the NAND market above $300 billion in 2026 and above $500 billion in 2027, with supply tightness extending into 2028. The FY2028–FY2030 model targets mid-to-high-teens annual revenue growth, non-GAAP gross margins around 80%, and adjusted free-cash-flow margins near 50%.

The strongest single datapoint for the bull case is the contract book: approximately $93.9 billion of minimum commitments across eight contracts with six customers, on four-year terms. Against FY2026 revenue of $20.25 billion, that is more than four years of current revenue contracted as a floor. Minimum commitments are not the same as recognised revenue, and the pricing within them is not disclosed — but as downside protection goes, it is unusually concrete.

The data-centre mix shift supports the same argument. Q4 data-centre revenue reached $2.98 billion, doubling sequentially and up 645% year on year, with SanDisk’s bit shipment share rising from roughly 12% to about 38% within a year. That is a genuine change in the customer base, not a price effect, and it is the part of the story that would survive a pricing normalisation. FinanceFeeds covered the event in its analysis of SanDisk’s answer to the peak-cycle fear.

The supply-side evidence is genuinely tight

The most persuasive support for SanDisk’s supply-tightness argument came from outside the company. Applied Materials, reporting on August 13, posted record revenue of $9.12 billion, up 25% year on year, with Semiconductor Systems at $7 billion. Its NAND commentary was the relevant part: wafer starts declining, and capital expenditure focused on upgrades rather than new capacity.

That is the equipment supplier — the company that would be first to see a supply response — reporting that the supply response is not being built. In a commodity cycle, that is the single most important variable, because shortages persist exactly as long as capacity additions lag demand. It is a meaningful, independent corroboration of the CFO’s 2028 claim.

Elon Musk’s observation in August 2026 that “memory is AI’s biggest bottleneck” is directionally consistent, though it is commentary rather than data and should be weighted accordingly.

The peak-cycle problem the contracts do not solve

Now the other side, stated as strongly as it deserves. An 84.6% gross margin is not a normal state for a memory business. Historically, NAND has been among the most brutally cyclical products in the semiconductor industry, with gross margins that swing from the seventies to negative territory across a cycle. SanDisk’s own FY2028–FY2030 model assumes approximately 80% — but the framing question is whether an 80% steady-state margin in a commodity industry is a plan or an aspiration.

The pricing-versus-volume split is the tell. If two-thirds of sequential growth is price, then a normalisation in NAND pricing does not merely slow growth — it reverses a large part of it, and it does so at the gross-margin line first, where the effect on earnings is amplified. The $93.9 billion contract book provides volume protection. It does not obviously provide price protection, because the contracted pricing is not disclosed.

Supply risk from China compounds this. FinanceFeeds examined CXMT’s Shanghai debut and its implications for the memory complex in its analysis of the listing. New Chinese capacity is precisely the supply response that ends shortages, and it arrives on a political timetable rather than an economic one.

What the FY2030 model is really claiming

SanDisk’s own long-range model deserves closer reading than it usually gets, because it contains an implicit concession. For FY2028–FY2030 the company guides to mid-to-high-teens annual revenue growth, non-GAAP gross margins around 80%, and adjusted free-cash-flow margins near 50%.

Set that against what the company is doing now. FY2026 delivered revenue growth of a wholly different order and a Q4 gross margin of 84.6%. The model is therefore not an extrapolation of the present — it is a guide to substantial deceleration, from a hyper-growth year to mid-to-high teens, with margins stepping down from 84.6% to roughly 80%. Management is telling investors the current run-rate is not the steady state.

That is creditable and it is also the crux. A 50% adjusted free-cash-flow margin sustained through FY2030 would be remarkable for any hardware business and unprecedented for a NAND producer across a full cycle. If it holds, today’s price is defensible on cash generation alone. If NAND behaves as NAND has always behaved, the margin assumption is the first thing to break, and the model’s mid-to-high-teens growth compounds off a much lower base than the guide implies.

The separation from Western Digital sharpens the point. SanDisk is now a pure-play NAND business, without the hard-disk-drive segment that historically dampened the swing in either direction. That focus is precisely why the stock rose 35-fold, and it is precisely why the downside is less cushioned than it would have been inside the combined company.

Where the analysts sit

Consensus across 23 analysts compiled by S&P Global stood at $2,094, with a range from $1,000 at the bearish end to $3,600 at the bullish, on a Buy consensus. J.P. Morgan moved to Overweight with a $2,250 target following the Investor Day. Bernstein carried $3,000 from late June, citing the contract book’s downside protection.

Two things stand out. The spread — $1,000 to $3,600, a 3.6x range — is extraordinarily wide for a covered large-cap, and it says the analyst community is no more settled on the terminal value than the share price has been. And the consensus of $2,094 sits 27.6% above the current $1,641.11, meaning the street collectively regards the 30.3% drawdown from June as an overreaction.

Bull case: $2,400

The bull case is that supply tightness genuinely extends into 2028, as both the company and its equipment supplier now indicate, and that the data-centre mix shift from 12% to 38% of bit shipments proves durable. On that path, Q1 FY2027 guidance of $10.3–10.8 billion is a waypoint rather than a peak, and the $93.9 billion contract book converts steadily.

A target of $2,400 is approximately 46% above spot and marginally above the 52-week high of $2,354.39. It sits modestly above the $2,094 consensus and well below Bernstein’s $3,000, which is the appropriate place for a case that requires the cycle to extend but not to re-accelerate to new extremes. Critically, it requires no expansion in the multiple — only that the guided revenue and margin profile is delivered while the cycle holds.

Bear case: $1,150

The bear case needs nothing from management. It needs NAND pricing to normalise. If the two-thirds of sequential growth attributable to price reverses even partially, revenue growth decelerates sharply and the 84.6% gross margin compresses toward historical norms — and because those two effects compound, earnings fall considerably faster than revenue.

The catalysts are identifiable: Chinese capacity additions arriving ahead of schedule, hyperscale customers digesting after a period of aggressive ordering, or simply the arithmetic of a market the CFO expects to grow from $300 billion to $500 billion attracting the capital that ends every shortage.

A target of $1,150 is roughly 30% below spot and sits above the $1,000 analyst bear low. It does not contemplate a return toward the $42.82 low of a year ago, because the business today bears no resemblance to the business then — FY2026 revenue of $20.25 billion and net income of $11.43 billion are real. It contemplates a cycle turning, which is the base rate for this industry.

The technology roadmap is the quiet advantage

One element of the Investor Day gets less attention than the contract book but may matter more over a full cycle. SanDisk’s ninth-generation 2Tb QLC 3D flash carries a 4.8 Gb/s interface, a 33% improvement, and tenth-generation NAND delivering 59% higher bit density than its predecessor entered production in July at the Kitakami Fab2 facility. The company also disclosed early technical specifications for High Bandwidth Flash through the Open Compute Project, with Google participating.

Bit density is the variable that determines cost per gigabyte, and cost per gigabyte is what decides who survives a downcycle. A producer entering a price normalisation with a 59% density advantage over its own prior generation is structurally better placed than one that is not, because the marginal cost floor falls with density. This does not prevent the cycle from turning. It changes who remains profitable when it does — which is the distinction between the bear case being a drawdown and the bear case being an impairment.

What to watch

Three signals rank above all others. First, the pricing-versus-volume split in the next quarterly disclosure: if the volume share rises above one-third, the growth is becoming more durable, and if it falls further, the opposite. Second, gross margin against the 83–85% guide, since that is where pricing normalisation appears first. Third, any change in Applied Materials’ NAND commentary — a shift from declining wafer starts and upgrade-focused capex toward new capacity would be the earliest available warning that the supply response has begun.

SanDisk has executed exceptionally and the contract book is a genuine asset. But at 35 times its price of a year ago, the share price is a wager on where the NAND cycle turns, not on how well the company is run. Those are different questions, and only one of them is within management’s control.

Frequently asked questions

How much has SanDisk stock risen in the past year?

SanDisk closed at $1,641.11 on August 14, 2026, against $46.68 on August 14, 2025 — a gain of 3,415.7%, or roughly 35 times. Despite that, it trades 30.3% below its 52-week high of $2,354.39 set on June 22, 2026.

Why did SanDisk stock rise 7% on August 14?

The gain came as the entire memory and storage complex moved higher together rather than on a SanDisk-specific catalyst. Sector-wide moves reflect a repricing of NAND as a commodity and say less about any individual company’s execution than stock-specific moves do.

Is SanDisk’s growth driven by price or volume?

Predominantly price. The company disclosed that roughly two-thirds of its sequential revenue growth came from pricing and one-third from volume. That matters because pricing-led growth reverses when a shortage ends, whereas volume-led growth reflects durable share gains.

What are analysts’ price targets for SNDK?

Consensus across 23 analysts compiled by S&P Global was $2,094, ranging from $1,000 to $3,600 on a Buy consensus. J.P. Morgan moved to Overweight at $2,250 after the Investor Day, and Bernstein carried $3,000 from late June.

What are the bull and bear targets for SanDisk?

This analysis sets a bull case of $2,400, about 46% above the $1,641.11 spot, requiring supply tightness to extend into 2028 as guided. The bear case is $1,150, roughly 30% below spot, requiring only that NAND pricing normalises and gross margins compress from 84.6% toward historical levels.

This article is informational analysis only and is not financial, investment, or trading advice. Equity markets are volatile and prices can fall as well as rise. Past performance does not guarantee future results. Do your own research and consult a regulated financial adviser before making any investment decision.

The received wisdom about SanDisk is that it got lucky on a commodity. NAND flash went short, spot prices ripped, and a spun-out memory business rode the cycle from a $29.62 low in April 2025 to $1,641.11 at the close on 14 August 2026. Tidy story. It is also the wrong one, and getting it wrong is why most investors will misread Fermi (NASDAQ: FRMI) at $6.40. What actually re-rated SanDisk was not the price of a bit. It was the conversion of spot exposure into contracted exposure — and on 13 August the company put numbers on exactly that, disclosing eight customers under long-term agreements covering roughly half of FY2027 bits. Fermi executed the first step of that identical conversion three days earlier, signing a 15-year, ~$6.5bn binding lease with TensorWave. The market has not repriced it. Eight analysts carry a $17.50 consensus target against a $4.10bn market cap.

The insight: multiples follow contracts, not commodities

Having tracked the memory complex through the whole of this cycle — the $8.97bn quarter that still sold off 8%, the Western Digital sibling trade, the peak-cycle fear that dominated the investor day preview — the single most instructive fact is this: SanDisk’s multiple did not expand when NAND prices rose. It expanded when the revenue stopped being spot.

At its 2026 Investor Day, SanDisk laid out an FY2028–FY2030 model of mid-to-high-teens revenue growth, roughly 80% non-GAAP gross margin, about 75% operating margin and around 50% adjusted free cash flow margin. Nobody underwrites those numbers off a commodity print. They are underwritten by the structure sitting beneath them: eight customers signed to what SanDisk calls New Business Model agreements, built on committed volumes, enforceable contractual frameworks and minimum financial guarantees, covering approximately 50% of bits in FY2027 and approximately two-thirds in FY2028. That is a cyclical business buying its way out of cyclicality. The re-rating is the market paying an annuity multiple for what it used to price as a commodity.

Now hold that template against Fermi. On 10 August the company signed its first binding lease at Project Matador: 222 MW of total facility power to TensorWave, a 15-year initial term with two five-year renewal options, approximately $6.5bn of contracted revenue, and expansion rights across two further data centres taking the site past 650 MW. Strip the sector labels and the two events are the same event. A capital-intensive asset with volatile, unbankable spot economics converts a slice of its output into long-duration contracted cash flow. SanDisk is roughly two-thirds of the way through that conversion and trades accordingly. Fermi has done it once.

Key facts

  • FRMI last close $6.40, down 82.7% from its $36.99 intraday debut high — Fermi Inc, 14 August 2026 (StockAnalysis)
  • Consensus price target $17.50 across 8 analysts; median $14.50, high $35.00, low $6.00 — StockAnalysis, August 2026
  • ~$6.5bn contracted revenue over a 15-year initial term from the TensorWave lease, 222 MW phase 1 — Fermi press release, 10 August 2026
  • ~6 GW of 17 GW planned capacity already permitted, with over $1.5bn invested in buildout to date — Fermi, 10 August 2026
  • $92m cash at Q2 2026 against $520m net debt pre-offering; $431m convertible notes at 5.00% due July 2031 — Fermi Q2 2026
  • SanDisk: 8 customers under long-term agreements covering ~50% of FY2027 bits and ~two-thirds of FY2028 bits — SanDisk Investor Day, 13 August 2026
  • SNDK $1,641.11, from a $29.62 closing low in April 2025 — a 55x move in 16 months (StockAnalysis)

What is actually being built, and why the site matters more than the buildings

Project Matador sits on roughly 5,769 acres in Carson County, north-east of Amarillo, Texas. The design is behind-the-meter: rather than queue for a grid interconnection, Fermi intends to generate on campus, combining natural gas, nuclear, solar and battery storage into what it markets as a private “HyperGrid.” Construction is visible rather than theoretical — 4.6 miles of natural gas lines, 11.3 miles of perimeter fencing, 7.2 miles of water distribution, and roughly 300 acres of land prepared. Federal air permits are secured for 6 GW with a further 5 GW filed.

The gas turbine strategy is deliberately staged around delivery lead times, which is the part most write-ups skip. Seven GE TM2500 mobile units (126 MW) carry a two-month delivery window. Three GE Vernova FR6B units (116 MW) come in eight months. Six Siemens SGT-800s land at fifteen months, with the larger SGT6-5000F frames at twenty-two. That ladder is what makes a 210 MW target for 1 July 2027 and roughly 640 MW by Q4 2027 credible rather than aspirational: the early megawatts arrive on mobile units while the heavy frames are still in transit.

Capital structure is where it gets genuinely interesting. Under a build-own-operate-transfer arrangement with the Hillcore Alliance, Hillcore finances, constructs and operates 2.6 GW of combined-cycle generation with zero capital required from Fermi. Fermi becomes anchor offtaker under a 20-year power purchase agreement with 10-year renewal increments, and holds an option — not an obligation — to acquire the assets at fair market value after year ten. A company with $92m of cash does not build 2.6 GW. It rents it, and keeps the call option.

The counterparty was explicit about why it signed. “Power is the critical constraint in AI infrastructure, and the vision and scope of what Fermi is building at Project Matador resonates with our own,” said Darrick Horton, CEO and Co-Founder of TensorWave. Fermi chairman Marius Haas framed it more plainly: “A lease of this size and this term is a tremendous vote of confidence in Fermi.”

Who is actually doing what: the industry response

The useful test of any “power is the bottleneck” thesis is whether the people who buy compute are behaving as though it is true. They are. In August, Amazon confirmed plans for a large dedicated gas power plant to supply a new AI data centre — when the largest buyer of compute on earth starts commissioning its own turbines rather than waiting in an interconnection queue, the constraint has demonstrably moved off the wafer and onto the electron. That is simultaneously the strongest validation of Fermi’s thesis and its most serious long-run competitive threat: hyperscalers that self-supply do not need a merchant campus.

TensorWave itself deserves scrutiny rather than applause, because it is the load-bearing wall of the entire bull case. It is an AI cloud that offers AMD GPUs exclusively, and it raised $350m in June 2026 at a reported $1.55bn valuation, co-led by AMD Ventures and Magnetar, after a $100m Series A in May 2025. The lease will house tens of thousands of next-generation AMD Instinct GPUs. Read that carefully: a company valued at roughly $1.55bn has signed a 15-year obligation of approximately $6.5bn. The contracted revenue is only as good as the counterparty’s ability to pay it across a decade and a half, and no amount of contract length fixes a thin credit. This is the honest gap in the SanDisk parallel — SanDisk’s eight NBM customers are, overwhelmingly, established hyperscalers and OEMs. Fermi’s one customer is a venture-backed startup.

On the equipment side, the incumbents are quietly confirming the same demand picture. Power and thermal infrastructure names have been repricing all year on data centre capex — the Vertiv setup is the cleanest read-through in the listed space. Fermi’s turbine order book with GE Vernova and Siemens Energy is a small, verifiable piece of that same flow.

The numbers: what $6.5bn actually implies

Run the arithmetic the market has not yet run. Approximately $6.5bn spread across a 15-year initial term is roughly $433m of contracted annual revenue. Against a $4.10bn market capitalisation on 640.47m shares, that single lease represents about 10.6% of the entire equity value in annual contracted revenue — from 222 MW. Per unit, the lease prices at roughly $29.3m per MW across the term, or about $1.95m per MW per year.

The leverage sits in what remains uncontracted. That 222 MW is about 3.7% of the 6 GW already permitted, and roughly 1.3% of the 17 GW long-term ambition. Applying the same per-MW economics to the already-permitted 6 GW is an arithmetic illustration rather than a forecast — it assumes flawless execution, unlimited demand and stable pricing, none of which are safe — but it frames why the $35 street high exists at all. The gap between the $6.00 low target and the $35.00 high is not a disagreement about this year’s earnings. There are no earnings. It is a disagreement about how many of the remaining megawatts get contracted, and to whom.

The near-term arithmetic is considerably less romantic. Fermi lost $26m in Q2 2026, or $0.04 a share, and burned $49m in operations — though that burn was down 50% quarter-on-quarter. Trailing twelve-month net income is -$737.9m against EPS of -$1.25. Revenue does not begin until late Q3 or early Q4 2027. That is more than a year of pure cash consumption before the first contracted dollar arrives, funded by $431m of convertible notes at a 5.00% coupon maturing July 2031, struck at a ~$9.52 conversion price with a $34.5m capped call limiting dilution to roughly 2% even if the stock triples. Net proceeds were $417m, with no financial maintenance covenants. That $9.52 conversion price is worth remembering: it is the most honest near-term line in the sand anyone has drawn on this stock, and it sits 49% above spot.

Permission to build is the real scarce asset

The regulatory tension in this story is not chips or capital. It is consent. The most-discussed data centre item on Hacker News in the past month was research showing most Americans say “not in my backyard” to AI data centres — 146 points and 309 comments — followed by a Wall Street Journal piece on a rural community that turned down $26m rather than host one. Local opposition has become the binding permitting constraint across the sector, and it is almost entirely absent from the models.

This is where Fermi’s least glamorous asset does the most work. An already-assembled 5,769-acre tract in sparsely populated Carson County, with roughly 6 GW of federal air permits already secured and another 5 GW filed, is a categorically different asset from a proposed campus outside a suburb. Texas offers a permissive state posture, and Texas Tech University System chancellor Brandon Creighton publicly welcomed the lease, saying “TensorWave’s selection of Fermi sends a strong signal about the enormous potential of this project.” The behind-the-meter design also sidesteps the multi-year ERCOT interconnection queue that gates conventional grid-connected projects.

The nuclear component is the piece to discount hardest. Fermi markets Matador as hosting one of the largest new nuclear complexes in America, but nuclear licensing runs on regulatory timescales measured in years and no NRC milestone featured in the Q2 disclosures. Every megawatt that matters before 2030 is gas, solar or storage. Investors paying for the nuclear narrative today are paying for an option with a very long expiry.

Governance: the overhang that just lifted

Any honest FRMI thesis has to deal with the year the company has had. Co-founder Toby Neugebauer was removed as CEO and subsequently terminated for cause, then ran a proxy campaign to call a special meeting and install John Sellers as chairman and CEO. He suspended it after securing consents from approximately 31.0% of outstanding shares against revocations of approximately 36.4%, one day after ISS recommended shareholders withhold consent. The seat sat empty for more than three months before Lee McIntire — formerly of CH2M Hill and of Bill Gates’ nuclear venture TerraPower — became CEO effective 11 August 2026.

Governance chaos of that magnitude is precisely why a stock trades at a third of its consensus target. It is also, mechanically, why the setup is interesting now: the proxy fight is resolved, the CEO seat is filled by an infrastructure builder, and the first binding lease landed within a fortnight of both. SanDisk’s own April 2025 low came when the market had written it off as a commodity business its parent had discarded. Assets get cheap when the story is embarrassing.

What happens next

Prediction one: the second tenant is the catalyst, not the first. One lease can be dismissed as a favourable deal struck with a friendly, venture-backed counterparty. Two leases establish that Matador has a repeatable commercial motion and that the per-MW pricing is a market rate rather than an anchor negotiation. SanDisk did not re-rate on customer one; it re-rated as the NBM count marched toward eight. Expect the next announcement to move FRMI more than this one did.

Prediction two: first power slippage is the highest-probability disappointment. Fermi targets first power in 2026 and roughly 210 MW by 1 July 2027. The mobile-turbine ladder makes those dates defensible, but a company that has never energised a campus is forecasting one on a schedule with no slack. Any slip pushes the late-2027 revenue start into 2028 and forces another financing at a lower price — the single most plausible path to the $6.00 street low.

Prediction three: credit quality of the offtake book becomes the whole argument by 2027. If Fermi’s next counterparties are investment-grade hyperscalers rather than venture-backed clouds, the contracted revenue starts deserving an infrastructure multiple and the SanDisk analogy holds. If the book stays concentrated in thinly capitalised AI startups, the market will keep discounting the contracts no matter how long their stated terms — and it will be right to.

The honest summary is that Fermi at $6.40 is not a cheap version of SanDisk. It is SanDisk in April 2025: unloved, structurally loss-making, governance-scarred, and sitting on an asset whose scarcity the market has not yet agreed to pay for. The difference between the $6.00 bear target and the $35.00 bull target is roughly fourteen months of execution. That is precisely how long SanDisk’s own re-rating took to become obvious, and by the time it was obvious the stock had already done most of it. For the fuller memory-side picture, our SanDisk bull and bear case maps where that trade now stands.

Frequently asked questions

What is Fermi’s possible price target?

The consensus price target across eight covering analysts is $17.50, implying roughly 173% upside from the $6.40 close on 14 August 2026. The median is $14.50, the street high is $35.00 and the street low is $6.00. The consensus rating is Buy, though the spread between the high and low targets is unusually wide because the company has no revenue yet and valuation depends almost entirely on how much of its permitted capacity gets contracted.

Why is FRMI stock down more than 80% from its high?

Fermi listed on 1 October 2025 and traded as high as $36.99 intraday on debut before falling to $6.40. The decline reflects a post-IPO valuation reset, a long pre-revenue runway with revenue not starting until late 2027, heavy cash burn, and a damaging governance fight in which co-founder Toby Neugebauer was terminated for cause and then ran an unsuccessful proxy campaign. The CEO seat was vacant for over three months.

How is Fermi similar to SanDisk?

Both are capital-intensive businesses in structurally short markets that the market initially priced as speculative or commodity exposure. SanDisk re-rated once it converted spot volume into long-term contracted agreements with committed volumes and minimum guarantees. Fermi has just executed the first version of that same conversion, turning speculative megawatts into a 15-year, ~$6.5bn contracted lease. The mechanism is contract structure, not commodity price.

Who is TensorWave and can it pay a $6.5bn lease?

TensorWave is an AI cloud provider offering AMD GPUs exclusively, backed by AMD Ventures and Magnetar. It raised $350m in June 2026 at a reported $1.55bn valuation. The obvious concern is that a company valued near $1.55bn has committed to roughly $6.5bn of payments over 15 years. Counterparty credit quality is the single largest unquantified risk in the Fermi bull case and deserves more scrutiny than the headline number gets.

Is Project Matador actually a nuclear project?

Not in any timeframe that affects the next several years. Fermi markets Matador as integrating nuclear alongside natural gas, solar and battery storage, but no NRC licensing milestone appeared in the Q2 2026 disclosures, and nuclear licensing runs on multi-year regulatory timescales. Every megawatt scheduled before 2030 comes from gas turbines, solar and storage. The nuclear element is best treated as a long-dated option rather than near-term capacity.

What would make the bear case right?

Three things. A slip in first power or the July 2027 210 MW milestone, which would push revenue into 2028 and force a dilutive financing. A failure to sign a second major tenant, which would leave the campus dependent on one thinly capitalised counterparty. Or a broader shift where hyperscalers self-supply power — as Amazon’s own gas plant plans suggest — removing the need for merchant AI power campuses altogether. UBS already carries a $6.00 target on essentially this reasoning.

This article is for information only and is not investment advice. Prices and analyst targets are as of the close on 14 August 2026 and will have changed.

Almost everyone reading Micron’s chart draws the wrong lesson from it. The stock went up roughly 8.4 times from its 52-week closing low of $115.79 to $971.66, so the instinct is to call it a bubble, or to say the move is over. Check the multiple and that reading collapses. Micron trades at 21.9 times earnings — a perfectly ordinary number for a semiconductor company. It did not re-rate at all. Trailing net income grew 710.7% to $50.47bn, and the share price simply chased it. That distinction is the whole of what follows, because it reframes the question people ask about Nebius (NASDAQ: NBIS) at $277.68. For Nebius to be the next Micron, it does not need investors to pay a higher multiple. It needs the opposite: it needs to de-rate into its own growth. On its own year-end guidance, it does exactly that — and Micron’s current multiple, applied to that guidance, prints $356 a share.

The insight: the bull case is a falling multiple, not a rising one

Here is the arithmetic that almost no one runs. Nebius carries a $76.11bn market capitalisation on 274.10m shares against trailing twelve-month revenue of $1.36bn. That is 56.0 times sales, a number that looks indefensible and gets the stock called a bubble on a daily basis. But revenue grew 506.9% over that period, so the trailing figure describes a company that no longer exists. Measured against the $3.0bn of annualised recurring revenue Nebius had actually reached by 30 June, the multiple is 25.4 times. Measured against the $7bn–$9bn year-end run-rate the company has guided to, the midpoint gives 9.5 times.

Micron trades at 12.2 times trailing sales today. So Nebius, at an unchanged share price, passes through Micron’s current valuation on the way down and ends up cheaper than it — purely by hitting its own guidance. Invert that and you get the headline number: apply Micron’s 12.2 times to Nebius’s $8bn guided run-rate and you get a $97.5bn market capitalisation, or roughly $356 a share, 28.1% above the current price. The $7bn low end gives $311; the $9bn high end gives $400.

That $356 is my arithmetic, not an analyst’s target, and it is a scenario rather than a forecast — it assumes Nebius hits guidance and that the market is willing to pay a memory manufacturer’s multiple for a compute landlord, neither of which is guaranteed. But it is the honest way to express the thesis, and it explains why the stock keeps confounding people who anchor on trailing numbers. Having watched this same confusion play out across the memory complex all year — through Micron’s own bull and bear case and the peak-cycle fear that dominated the NAND narrative — the pattern is consistent. Shortage-driven businesses look expensive on trailing data right up until the earnings land, and then they look cheap in hindsight.

Key facts

  • NBIS last close $277.68, up 8.88% on the day; 52-week closing range $64.06 to $286.69 — 14 August 2026 (StockAnalysis)
  • Street consensus $226 — below the current price, across 18 analysts; high $410, low $120 (MarketBeat, August 2026)
  • Q2 2026 revenue $582m, up 454%; AI cloud revenue $575m, up 514%; adjusted EBITDA $236m at a 41% margin, against a $21m loss a year earlier — Nebius, 12 August 2026
  • ARR $3.0bn at 30 June, up 56% from $1.9bn in March; year-end run-rate guidance $7bn–$9bn
  • Customer prepayments cover 50%–60% of associated capex on four Q2 contracts averaging over $1bn each — Nebius Q2 2026
  • Micron: 16 strategic customer agreements, ~$100bn minimum contracted revenue, covering ~20% of DRAM volume and a third of NAND volume through calendar 2030 — Micron fiscal Q3 2026
  • Micron trades at 21.9x earnings after an 8.4x move, because net income grew 710.7% to $50.47bn (StockAnalysis)

What Micron actually did — and it was not riding a price spike

Micron’s fiscal third quarter of 2026 produced $41.5bn of revenue, up 74% sequentially and 346% year on year, at a company-record 84.9% gross margin. Those are the numbers everyone quotes. The number that explains the durability is different: 16 strategic customer agreements representing approximately $100bn in minimum contracted revenue, covering roughly 20% of DRAM volume and about a third of NAND volume through calendar 2030.

That is the structural change. A memory manufacturer’s historic problem was never demand — it was that demand arrived at prices set by a brutal spot market, so good years were unbankable and the equity never earned a durable multiple. By pre-selling a fifth of DRAM volume years forward at contracted minimums, Micron converted the least predictable part of the business into something closer to an infrastructure contract. CEO Sanjay Mehrotra called the quarter “exceptional,” with results that “exceeded the high end of guidance across all metrics.” HBM4 has already shipped over $1bn of revenue.

The tell that this is a genuine shortage rather than a hype cycle is the direction the money flows. In a normal market, a supplier funds its own capacity and hopes customers show up. In a real shortage, customers pay in advance to reserve supply, because the risk of not having it exceeds the cost of pre-committing. Micron’s $100bn of minimum contracted revenue is that signature at scale.

Nebius is showing the same signature, one stage earlier

Nebius closed four AI cloud contracts in Q2, each averaging more than $1bn, with Reflection, Cohere, a US “neolab” and a US quantitative trading firm. The terms run one to three years at a revenue yield of $20m–$25m per megawatt. The critical detail is the financing: customer prepayments cover 50% to 60% of the associated capital expenditure. Nebius’s customers are funding roughly half of the buildout that serves them, in advance. That is Micron’s prepayment dynamic, arriving in compute.

The pricing tells the same story from the other side. While long contracts price at $20m–$25m per megawatt, Nebius sells shorter capacity — up to six months — at $40m–$50m per megawatt, occasionally higher, to customers who need dedicated clusters for time-sensitive training runs. Spot is roughly double contract. A supplier that can charge twice as much for immediacy is not operating in a competitive commodity market. Founder and CEO Arkady Volozh put the resulting position bluntly: “We choose when to sell, to whom we sell, and on what terms, and how we finance everything.”

The operating leverage is already visible rather than promised. Adjusted EBITDA swung to $236m, a 41% margin, from a $21m loss a year earlier and 32% in Q1. Revenue reached $582m in the quarter, up 454%, with the AI cloud segment at $575m and 98% of the group. Capex ran at roughly $5.7bn in the quarter against full-year guidance of $20bn–$25bn, targeting 5 GW of connected power by year end. Our full breakdown of the Q2 numbers covers the capex quarter in detail.

Nvidia’s position is the other structural signal. In a Schedule 13G filed on 13 July 2026, Nvidia disclosed beneficial ownership of 22,256,412 shares — 1,190,476 held directly plus 21,065,936 underlying a pre-funded warrant acquired on 11 March — for 9.3% of the company, stemming from a $2bn strategic investment. Choosing a 13G over a 13D signals passive intent. Nvidia allocating both capital and, implicitly, supply priority to a customer is the closest thing to a qualification decision this industry produces.

Where the analogy breaks, and it breaks hard

Any honest version of this thesis has to state the disanalogy plainly, because it is severe. Micron manufactures a physically scarce product that is extraordinarily difficult to make. That is why it earns an 84.9% gross margin and why its moat compounds. Nebius rents out someone else’s chips. It must buy GPUs from Nvidia — its own 9.3% shareholder — at whatever Nvidia charges, and its economics are bounded by that input cost forever. A 40% adjusted EBITDA margin is a good business; it is not an 84.9% gross margin, and no amount of scale closes that gap.

The funding asymmetry is just as stark. Micron self-funds its capacity out of $50.47bn of trailing net income. Nebius is guiding to $20bn–$25bn of capex against a $76.11bn market capitalisation and trailing net income of $42.40m — essentially zero. Prepayments cover half of it, which leaves roughly $10bn a year to be financed from somewhere, and that somewhere is debt or equity. The comparison that matters here is CoreWeave, whose $104.2bn backlog sits alongside a debt load that dominates its story. Backlog is not cash, and neoclouds are financing businesses wearing technology clothing.

Then there is the competitive question nobody has answered. GPU rental has no obvious technical moat. If capacity catches up with demand, the $40m–$50m per megawatt spot pricing is the first thing to go, and the contracted book becomes a floor rather than a springboard. Micron’s shortage is enforced by physics and by a three-player oligopoly. Nebius’s is enforced by a temporary imbalance between Nvidia’s output and everyone’s ambition — a condition with no guarantee of permanence.

The street is not on board, and that is the live tension

The most striking fact in the data is that Nebius trades above where analysts think it should. Across 18 analysts the consensus target is $226, roughly 19% below the $277.68 close. The dispersion is extraordinary: Northland’s Nehal Chokshi raised to $410 on 20 July, Robert W. Baird went to $340 on 13 August and Citi to $324 on 14 August, while DA Davidson sits at $175 on a Neutral and Morgan Stanley’s Josh Baer carries $144 at Equal Weight. A high target 3.4 times the low one is not a disagreement about next quarter. It is a disagreement about whether this is infrastructure or a rental business in a cyclical upswing.

The near-term regulatory-style overhang is not a regulator at all but a lock-up. Nvidia’s contractual restrictions prevent it from exercising the warrant or selling the underlying shares before 11 September 2026. We covered what that date means for the stock when the stake was disclosed. A 9.3% holder becoming free to sell is a mechanical supply event regardless of intent, and it lands inside the next month. Anyone underwriting the $356 case should expect that date to be noisy.

What happens next

Prediction one: the year-end run-rate number is the entire thesis, and it is checkable. Nebius has guided to $7bn–$9bn of annualised run-rate revenue by year end, from $3.0bn ARR in June. That is roughly a tripling in six months, and it is the single input that drives every valuation conclusion here. Hitting the midpoint validates the $356 arithmetic. Landing at $5bn does not just miss — it resets the multiple to 15.2 times, above Micron’s, and the entire “cheaper than Micron” argument disappears.

Prediction two: the prepayment percentage matters more than the contract count. Watch whether prepayments stay at 50%–60% of associated capex on new deals. If that ratio holds or rises, the shortage is real and customers are still bidding for certainty. If it drifts down, it means Nebius is having to fund its own growth to win business, which is the first sign the market is normalising — and it would show up long before pricing cracks.

Prediction three: 11 September resolves an overhang in one direction or the other. Either Nvidia’s lock-up lapses without a sale, which reads as an endorsement and removes a discount, or paper starts moving. Given the stock already trades 23% above consensus, that date is the most likely near-term source of a sharp move in either direction.

The uncomfortable conclusion is that both the bulls and the bears are anchoring on the wrong number. Bears point at 56 times trailing sales and call it absurd; bulls point at 454% growth and call it inevitable. The number that decides it is the year-end run-rate, because that is what converts an expensive-looking stock into a cheap-looking one without the price doing anything at all. Micron’s investors learned that lesson the slow way, watching a stock they thought had run too far keep pace with earnings that ran further. Nebius is at the stage Micron was at before the contracted revenue showed up in the accounts — with the important difference that Micron owned its scarcity, and Nebius is renting someone else’s.

Frequently asked questions

What is Nebius’s possible price target?

The 18-analyst consensus is $226, which is about 19% below the $277.68 close on 14 August 2026 — the street currently thinks the stock has run ahead of itself. The street high is $410 from Northland Securities and the low is $120. The $356 figure in this article is not an analyst target: it is Micron’s current 12.2x trailing sales multiple applied to Nebius’s own guided $8bn year-end run-rate revenue, which implies roughly 28% upside.

Why does Nebius look so expensive on trailing numbers?

Because trailing numbers describe a company that no longer exists. Revenue grew 506.9% over the trailing twelve months to $1.36bn, so 56 times trailing sales is measuring today’s market value against a much smaller past business. Against the $3.0bn ARR Nebius had reached by June, the multiple is 25.4x, and against its $7bn–$9bn year-end run-rate guidance it is roughly 9.5x at the midpoint.

How is Nebius similar to Micron?

Both operate in genuine shortages where customers pay in advance to secure supply. Micron has 16 strategic customer agreements worth about $100bn in minimum contracted revenue through 2030. Nebius has customers prepaying 50%–60% of the capex needed to serve them. In both cases the customer is financing the supplier, which only happens when the scarcity is real rather than narrative.

How is Nebius different from Micron?

Fundamentally, and this is the main risk. Micron manufactures a physically scarce product and earns an 84.9% gross margin from a three-player oligopoly protected by manufacturing difficulty. Nebius rents GPUs it must buy from Nvidia, so its margins are structurally capped by its input cost. Micron self-funds capacity from $50bn of net income; Nebius is spending $20bn–$25bn a year against near-zero net income and must raise the difference.

What happens on 11 September 2026?

Nvidia’s contractual lock-up on its 9.3% Nebius stake expires. Nvidia holds 22,256,412 shares, mostly through a pre-funded warrant, and cannot exercise or sell before that date. Once it lifts, a large holder becomes mechanically free to sell. That does not mean it will — the passive 13G filing suggests otherwise — but the date is a known potential source of volatility.

What would make the bear case right?

Missing the year-end run-rate guidance is the main one: at $5bn rather than $8bn, Nebius would trade above Micron’s multiple and the valuation argument inverts. Beyond that, a falling prepayment ratio would signal the shortage easing, GPU supply catching up with demand would compress the $40m–$50m per megawatt short-term pricing, and the roughly $10bn a year of capex not covered by prepayments has to be financed in markets that may not always be open.

This article is for information only and is not investment advice. Prices, multiples and analyst targets are as of the close on 14 August 2026 and will have changed.

Tech investors are back in record territory, but the relentless rally carries an expensive question.

The Nasdaq is up 15% in 2026, even as the AI arms race continues to accelerate, according to Reuters.

Consensus estimates put combined CapEx spending by five of the biggest U.S. hyperscalers near $730 billion this year, as per Reuters, prompting Wall Street to question whether cloud and AI revenue can continue to outpace the cash going into data centers.

Legendary fund manager Stanley Druckenmiller has hardly sounded euphoric.

Earlier this year, the billionaire investor said that AI was no longer playing the starring role in his illustrious portfolio, recalling that the trade had become “disturbingly heated” last summer.

That makes his big Q2 move especially interesting.

Druckenmiller’s Duquesne Family Office opened a brand-new position in one of the most dominant tech companies in the world, investing in 336,300 shares valued at roughly $120 million at quarter-end.

Stanley Druckenmiller opened a $120 million Alphabet position during the second quarter

Jeenah Moon/Bloomberg via Getty Images

Druckenmiller reenters Alphabet with a $120 million bet 

Druckenmiller just dropped $120 million on Google-parent Alphabet (GOOG) in Q2, according to an SEC filing.

More Manager Buy/Sells:

Duquesne owned zero Alphabet shares at the end of Q1 after selling the entire 385,000-share position. By June 30, he was back with 336,300 Class A shares worth north of $120.2 million, according to 13f.info

In many ways, that reversal fits Druckenmiller’s approach. 

He has often said that most trades are usually conceived over an 18-month-to-three-year horizon, but he heads for the exit or reverses them quickly when the facts change.

Additionally, he focuses on what the business may look like going forward, rather than what investors are already aware of.

Alphabet’s quarterly numbers give that forward-looking thesis plenty to work with. Q2 sales revenue has surged 24% to $119.8 billion, while operating income rose 30% to $40.8 billion. More importantly for the AI thesis, Google Cloud sales supercharged 82% to $24.8 billion, and Cloud operating income more than tripled to $8.8 billion.

The demand pipeline is also getting harder to brush aside.

Google Cloud backlog surged to $513.9 billion at quarter-end, up from $462.3 billion in March, with Alphabet expecting to recognize just over 50% of total backlog over the next 24 months.

What sets Google apart in the AI race is that it acts as both an AI platform and an infrastructure provider.

Gemini models, enterprise AI products, custom TPUs, Search, and Cloud offer multiple ways to monetize the same compute buildout, rather than relying on a single AI product.

Interestingly, Druckenmiller isn’t alone in seeing something there. Warren Buffett’s Berkshire Hathaway (BRK.A, BRK.B) also disclosed an Alphabet stake in Q3 2025 and has since substantially increased it, raising the position by another 83% in Q2 2026 to 106 million shares, according to Investing.

Moreover, the stock has also pulled back from its May record above $400 to about $346, offering a more attractive entry point according to Yahoo Finance.

Druckenmiller’s other big Q2 moves 

Alphabet was far from being Duquesne’s most aggressive move.

During Q2, Druckenmiller spread capital across AI infrastructure, biotech, and media. 

Amazon (AMZN) was perhaps the most clear increase. Duquesne added 495,800 shares, beefing up the position more than tenfold to 541,600 shares worth $129.1 million. It also added 259,300 shares underlying Amazon calls, taking the position to an impressive 459,300 shares worth $109.5 million. 

Amazon killed it with its Q2 results, spearheaded by a superb AWS showing, with Q2 cloud sales up 37% to $42.2 billion and AWS operating income reaching $16.6 billion. That gives Druckenmiller AI exposure through a business that’s already converting CapEx into higher growth and profits.

Taiwan Semiconductor (TSM) remained another major AI-chain bet. 

Duquesne added 94,400 shares, bumping the stake to 19% to 589,680 shares worth $281.6 million. TSMC’s Q2 profit skyrocketed 77% as per Reuters, while management bumped 2026 sales expectations and capital spending on persistent AI-chip demand.

Similarly, the family office loaded up on STMicroelectronics (STM), increasing its stake by 490,000 shares to 3.10 million, valued at $232.4 million. 

Though it may look more contrarian on paper, STM’s Q2 sales jumped 26%, and management expects acceleration from AI-data-center and low-Earth-orbit programs.

Insmed (INSM) was a concentrated position in the healthcare space, where Duquesne added 270,600 common shares to 1.42 million, worth $151.9 million, while opening call options covering another 1.35 million shares worth $143.9 million. The company’s non-cystic fibrosis medicine BRINSUPRI revenue jumped 49% sequentially in Q2, prompting higher full-year guidance.

Seagate (STX) increased by 71,300 shares to 122,000, worth $117.7 million, targeting the AI infrastructure trend as the company’s fiscal Q4 free cash flow reached $1.1 billion.

Natera (NTRA) gained 122,700 shares, taking Duquesne’s stake to 3.19 million shares worth $864.9 million. The company’s Q2 salesimpressed, growing 37.7%, and oncology testing volumes jumped 57.2%, underscoring the case for continued gains in diagnostic market share.

Finally, Duquesne initiated a 2.20 million-share position in Fox (FOXA), worth $115.0 million, targeting robust advertising growth at the media company.

Stanley Druckenmiller’s investing strategy explained 

Druckenmiller built his reputation by layering macro analysis with concentrated, high-conviction bets.

He founded Duquesne Capital in 1981 and ran the hedge fund through 2010, handling external capital with nearly 30% annualized returns and no losing years. Today, he manages his own capital through Duquesne Family Office, with Forbes putting his net worth at $7.8 billion.

His investing approach is highly adaptive. 

Druckenmiller is looking for major economic and technological shifts, using companies and market internals to test the macro picture, and sizing aggressively when conviction is high. 

“Sometimes when the opportunity is so big and you just kind of know it, you’ve just got to plunge in without the proper information,” Druckenmiller said recently.

His mindset has produced some of the most prescient market calls. 

While managing billionaire George Soros’ capital, Druckenmiller identified a major weakness in the British pound ahead of the 1992 sterling crisis, which helped drive a trade generating north of $1 billion, according to Investopedia

More recently, Druckenmiller scooped up shares of Nvidia stock in late 2022, before ChatGPT ignited the AI boom, according to Yahoo Finance, and then continued adding to his position as conviction grew.

Related: 5-star analyst sets jaw-dropping Micron stock price target for 2026

Back in July, I wrote an article titled “Bank of America warns America now has 2 economies.”

At the time, the bank’s analysts saw an increasingly uncomfortable split beneath what has otherwise been a resilient U.S. economy.

BofA used the popular term “K-shaped recovery” to describe the setup, or “reflation for higher-income households, stagflation for lower-income households.”

Put simply, the wealthier households continue benefiting from robust balance sheets, elevated asset values and a strong stock market. At the same time, lower-income Americans are squeezed by sticky prices, higher borrowing costs and energy pressure.

Essentially, two groups living in the same economy move in opposite directions. One arm rises while the other is under duress.

Moreover, that gap was striking. At one point, BofA’s internal data showed spending by the top 1% up 9%, versus 5.5% for lower-income households.

Fast forward just a month though, and something unexpected happened.

Bank of America’s newest consumer data shows what it calls a “great convergence”, particularly where it matters most for household spending. 

Bank of America says spending growth is converging across major income groups

Krisztian Bocsi/Bloomberg via Getty Images

America’s K-shape has changed shape 

I attended BofA’s webinar featuring Aditya Bhave, head of U.S. economics for BofA Global Research, and David Tinsley, senior economist at Bank of America Institute, on the state of the U.S. consumer, the K-shaped economy, and what comes next.

More Bank Stock Resets:

My biggest takeaway from the meeting was that something big has changed inside America’s two-speed economy. 

For nearly the previous 12 to 18 months, the bank’s internal data underscored a familiar K-shape, where high-income households spent about 1 to 2 percentage points quicker than middle- and lower-income consumers month after month.

That said, the gap has now narrowed.

Spending growth across lower-, middle-, and higher-income households has moved at the same rate, with discretionary spending converging near 5% year over year. As Tinsley put it, “There has been a closing of the K in this data, be in no doubt.”

Importantly, according to BofA that convergence is also visible on discretionary categories, making the shift a lot more meaningful.

However, this doesn’t mean America’s K-shaped economy disappeared.

The top 5% remain an exception, with spending growth still running at nearly 1.5 percentage points faster than the rest, backed by tremendous stock-market wealth effects.

That leaves out a far more complicated picture with cash-flow behavior converging while the underlying wealth divide remains intact.

Bhave captured that uncertainty by saying that “The K is converging for now, but I wouldn’t be completely shocked if it starts to open out again.”

Why the bottom of the K suddenly looks stronger

Perhaps the most consequential shift in Bank of America’s data is actually linked to income. 

For the lion’s share of 2025 and early 2026, after-tax wage growth for lower-income households was stuck at 1% to 1.5%.

Over the past two to three months, though, BofA said the rate accelerated toward 5%, roughly aligning or at times exceeding the growth for other income groups.

That essentially switches up the quality of the consumer story.

Lower-income card spending is also growing at 5%, suggesting BofA is seeing something close to a balance between paycheck growth and spending growth.

Importantly, the bank doesn’t see clear evidence that households are financing the elevated spending through savings drawdowns or credit. Interestingly, balances for households earning below $50,000 are only slightly behind and roughly flat year over year, while BofA sees no meaningful inflection in financial stress.

BofA sees two possible explanations for the rise in income. 

The first and stronger point pertains to job switching. Lower-income workers have been looking to change jobs more often, and BofA estimates those moves could produce nearly a 10% after-tax pay increase.

On the flipside, the other explanation is less durable.

Some households might have lowered their tax withholding, temporarily raising take-home pay without an improvement in underlying wages.

That distinction is important because if wages are actually strengthening, the bottom of the K is getting stronger. However, if withholding is doing much of the work, this could be more of a temporary cash flow boost.

National data adds another reason to be cautious.

Real average hourly earnings dropped 0.2% year-over-year in July, with payrolls dropping by 23,000 and unemployment holding at 4.1%.

What this means for America’s 2 economies 

Perhaps the biggest implication is that America might still have two economies, but the dividing line seems to have pushed higher. 

Earlier in the K-shaped cycle, we saw the split as being mainly between affluent households and everyone below them. 

However, BofA’s latest data looks a lot different: lower-, middle- and most higher-income households are converging, while the top 5% remains the exception.

Their spending growth is still running at 1.5 percentage points quicker than everyone else’s, with BofA pointing to booming stock markets and wealth effects as major reasons.

In many ways, that suggests that the K might be less about income and more about ownership. 

Specifically, cash flows are converging. Even discretionary spending, taking out necessities such as gasoline and groceries, shows the gap narrowing.

Moreover, restaurant spending levels have actually crossed over, with lower-income growth recently running slightly higher than higher-income spending. Airlines and clothing remain important exceptions. However, balance sheets remain divided.

Higher-income households are still more exposed to stocks and homeownership, while lower-income consumers are more likely to rent. BofA says the productivity gains are flowing substantially into the stock market, underscoring the wealth advantage at the top.

That is why this convergence might still prove fragile.

BofA simultaneously expects 75 basis points of Fed hikes this year, and Bhave openly acknowledged that higher rates could potentially hurt lower-income households a lot more through the delinquency channel.

So the irony is hard to miss: the Fed might end up reopening the very K that is now closing.

For investors, that makes wages, rates, stock market wealth and consumer credit the key fault lines to look for ahead. 

Related: 5-star analyst sets jaw-dropping Micron stock price target for 2026

Warren Buffett spent years telling anyone who would listen that airlines were a terrible business to own.

Buffett called them a “capital trap,” a place where fuel costs and fare wars could erase profits almost overnight.

Then Covid hit, and Berkshire Hathaway dumped its entire airline portfolio in 2020, locking in steep losses. “The world has changed for airlines,” Buffett said at the time. 

So it says something that Berkshire (BRK.A) has now done the opposite. The conglomerate has been steadily building a position in Delta Air Lines, and the numbers show real conviction. 

Berkshire raises stake in Delta Air Lines stock

According to recent 13F filings, Berkshire’s stake in Delta jumped 44% during the second quarter of 2026, climbing to 57.3 million shares. That position was worth roughly $5.4 billion at the end of June.

Back in May, I reported that Berkshire had already built a Delta position worth about $2.6 billion as of the end of March 2026. 

That earlier purchase came during Greg Abel‘s first quarter running Berkshire after taking over as chief executive from Buffett in January.

Abel had laid out his approach to shareholders in February. He wrote that Berkshire has “core” positions it will not sell, but outside those, the firm plans to stay disciplined and concentrated. 

The Delta buy, and the decision to nearly double down on it a quarter later, fits that description closely.

Why Delta looks different now

Delta’s numbers help explain the appeal.

The airline reported record second-quarter revenue of $17.7 billion, up 14% from a year earlier, even though capacity only grew about 1%. It reported a unit revenue growth of 12.4% in Q2.

Pretax profit stood at $1.4 billion, with earnings of $1.56 per share and an operating margin of 9%, all ahead of the guidance Delta gave at the start of the quarter. 

Return on invested capital stood at 11%, comfortably above the company’s cost of capital.

More Airlines:

Delta is also less dependent on ticket sales than it used to be. 

  • Diverse revenue streams, things like premium seating, loyalty programs, cargo, and maintenance work, made up 61% of total revenue in the quarter. 
  • Premium and loyalty revenue each grew nearly 20%. 
  • Cargo revenue jumped 39%, and the airline’s third-party maintenance business grew more than 30%.

The American Express partnership is a big piece of that shift. 

Card spending has grown by double digits for seven straight quarters, and Delta expects to collect $9 billion from Amex this year, up 10% from 2025.

“Our Delta Amex co-brand card continues to lead the industry, and our recent portfolio enhancements are strengthening the value proposition for both existing and prospective cardholders,” Delta CEO Ed Bastian stated.

Ed Bastian CEO of Delta Air Lines is optimistic on rising premium spending.

Bloomberg/Getty Images

Delta’s balance sheet focus

Delta’s total shareholders’ equity has climbed steadily, from $15.3 billion at the end of 2024 to $20.9 billion at the end of 2025, and now sits at $21.8 billion.

Long-term debt has been moving in the opposite direction, falling from $14 billion at the end of 2024 to $12.5 billion at the end of 2025, and down to $10.5 billion at the end of Q2. 

Delta ended the June quarter with adjusted net debt of $13.6 billion, down from the start of the year, even as much of the airline industry raised additional capital.

Related: Warren Buffett named these 3 stocks as favorites for a reason

Delta expects gross leverage to reach 2x by year-end, moving toward a long-term target of 1x. All three major credit rating agencies still rate Delta at investment grade.

Cash generation backs this up.

The company produced $8.1 billion in operating cash flow on a trailing basis and $3.4 billion in free cash flow, even after spending $4.7 billion on capital projects like new aircraft and lounges.

What this means for Delta stock going forward

Delta is not backing off its outlook, either. 

The airline is guiding to full-year earnings of $6.50 to $7.50 per share, marking 20% growth from last year, along with $3 billion to $4 billion in free cash flow. 

Management also pointed to a longer-term goal of mid-teens operating margins and returns on invested capital.

Bastian argued on the July earnings call that the industry itself has changed in ways that favor his airline specifically, pointing to reduced discount capacity, higher loyalty spending and diversified revenue as reasons the current momentum should hold, even if fuel prices ease.

For Berkshire, which already walked away from airlines once, doubling its Delta stake in a single quarter suggests Abel and his team see something durable here, not just a short-term rebound.

Related: Raymond James makes surprising call on Delta Air Lines

There is a point where money stops compounding and starts collecting. Past a certain size, the marginal dollar cannot buy a better return. It can only buy things that were never for sale.

Sports franchises sit at the very top of that list. There are 20 Premier League clubs in any given season, maybe a dozen with real global pull, and almost none of them come to market by choice.

For most of the past 15 years, the smart money went American. NFL and NBA franchises kept resetting records while European soccer got written off as a vanity trap, a business with no salary cap, no meaningful revenue sharing, and a relegation trapdoor cut into the floor.

That consensus has quietly flipped. Apollo took control of Atlético Madrid this spring. Jim Ratcliffe bought into Manchester United in 2024. The capital that used to avoid the sport is now underwriting it.

On Friday, Aug. 14, the third-richest person alive joined them. Jeff Bezos is putting personal money into Liverpool Football Club, his first investment in a sports team, and the terms buried underneath the announcement matter far more than the price tag.

FSG agrees to sell a minority stake to Jeff Bezos-led consortium 1892 Holdings.

Chris Brunskill/Fantasista / Getty Images

Why soccer clubs became billionaire trophy assets

Scarcity explains part of the repricing. Media rights inflation explains the rest, and it is the part most investors underrate.

Live sports were treated as a subscriber-retention moat rather than a content line item. Owning the moat is one thing. Owning the thing everyone is bidding for the right to broadcast is another.

Related: Adidas’s World Cup soccer jerseys are an additional 30% off the sale price

Liverpool has been the cleanest demonstration of that math in world soccer. The club posted €836.1 million in revenue for the 2024/25 season, ranking fifth globally and becoming the highest-earning English club for the first time in the survey’s 29-year history, according to Deloitte.

When I ran FSG’s original outlay against the price implied by this deal, the return is the story. A £300 million rescue in 2010 has become an asset changing hands at more than 14 times that figure, and it happened in a sport American investors spent a decade calling uninvestable.

What the Liverpool stake actually buys

FSG has entered a definitive agreement to sell a minority equity stake to 1892 Holdings, a consortium “led and managed by Amit Bhatia,” with money from Bhatia and the Mittal Family Trusts, K5 Sports and the Saverin family office, according to a club statement.

More Sports Business:

The stake is roughly 30% and FSG keeps majority ownership and operational control, per that same statement, which disclosed no price. Bhatia becomes vice chairman and joins an expanded board.

Bezos does not. He is the lead investor in the K5 Sports fund, and he will not take a board seat, according to CNBC.

Here is the clause that reframes everything. The investment group holds an option to become Liverpool’s majority shareholder at a valuation near $8 billion within the next 12 months, CNBC reported, citing a person familiar with the matter.

That is not a minority investment. That is a call option on an English institution, written at a fixed strike, with a year to decide.

The numbers around it:

  • FSG bought Liverpool in 2010 for £300 million, about $476 million at the exchange rates of the time, according to Sportico.
  • The consortium is buying about 30% at a valuation of just over $7 billion, a record for a soccer club investment that tops the roughly $5.8 billion enterprise value on Ratcliffe’s 2024 Manchester United stake, reported Sportico.
  • Forbes valued Liverpool at $6.2 billion in its 2026 rankings, fourth among all soccer clubs, according to Forbes.
  • Bezos previously explored ownership of the NFL‘s Washington Commanders and Seattle Seahawks without closing a deal, according to CNBC.

Timing deserves a mention. Liverpool finished fifth in the 2025/26 Premier League, lost Mohamed Salah, and watched Arsenal end a 22-year title drought. FSG is selling a third of the club at a record price off a disappointing season, which is usually the sign of a seller who thinks the number will not get better.

The Amazon connection investors should watch

Nothing here touches Amazon (AMZN) shareholders directly. This is Bezos’s own capital, moving through a private fund, into a private asset. He stepped back from the chief executive role in 2021 and serves as executive chairman.

The overlap is still worth logging. Prime Video holds UEFA Champions League packages in the United Kingdom, Germany and Italy, and its 11-year National Basketball Association deal is worth about $1.8 billion a season, which puts Amazon on track to spend roughly $3.8 billion on sports rights in 2026 and outspend every other streamer, according to SportsPro, citing Ampere Analysis.

Liverpool qualified for the 2026/27 Champions League. Its founder-chairman’s company sells those matches in three of Europe’s largest markets.

Amazon also walked away from live Premier League rights in the United Kingdom after the 2024/25 season, ceding the packages to Sky and TNT. Anyone reading this as Amazon buying its way into English soccer has the direction of travel backwards. The company left the broadcast side. The founder bought the asset.

What to watch over the next 12 months

The clock on that majority option starts once the deal clears regulatory approval, and the Premier League’s owners’ and directors’ test is the first gate.

Watch whether 1892 Holdings exercises it. A group willing to pay $8 billion for control of a club it just valued at $7 billion is telling you it expects the next media rights cycle, beginning in 2029/30, to reprice the entire league again.

And watch Anfield ticket prices. Liverpool already pulled back planned increases after fan protests, per Forbes. Control changing hands at these multiples eventually shows up on a matchday stub, which is the part of this deal supporters will feel long before any investor does.

Related: The World Cup just rewrote the economics of sports

Wall Street loves a good redemption arc, but it rarely hands one out for free. The market makes companies wait, publicly and sometimes painfully, before admitting they belong.

Few companies know that waiting game better than Reddit (RDDT). For two decades, the platform was the internet’s message board, a sprawling collection of forums where people argued about everything from sourdough starters to short squeezes. Its WallStreetBets community lit the fuse on the 2021 meme stock frenzy, turning GameStop (GME) into a household name and Reddit itself into shorthand for everything professional money managers distrusted about retail traders.

Then the company went public in March 2024, and the punchline started to fade. Revenue accelerated, profits showed up, and the business kept compounding. Still, 2026 has been unkind. The stock surrendered roughly a third of its value this year as investors worried that artificial intelligence (AI) summaries from Google (GOOGL) were siphoning off the search traffic Reddit relies on to attract new users.

That gloomy backdrop is what makes this week’s announcement so striking. Reddit is joining the S&P 500, and the invitation arrived at one of the lowest moments of its short public life.

How Reddit went from meme stock chaos to the S&P 500

The S&P 500 is less a list than a certification. Membership requires a U.S. domicile, enough shares trading freely, a market value above the committee’s bar and, crucially, sustained profitability. Plenty of well-known companies wait years at the door, and Reddit itself was passed over in earlier reshuffles this year, according to Benzinga.

The numbers finally made the case impossible to ignore. When I ran Reddit’s recent quarters against the sticking points that usually keep companies out, the profile looked more like a seasoned index name than a two-year-old public company:

  • Second quarter sales grew 61% year over year while adjusted EBITDA (earnings before interest, taxes, depreciation, and amortization) margins expanded 920 basis points, according to Morningstar.
  • The quarter was Reddit’s eighth straight with revenue growth above 60%, according to CNBC.
  • Revenue reached about $805 million and diluted earnings per share (EPS) came in at $1.25, both topping Wall Street estimates, according to Proactive Investors.
  • Third quarter revenue guidance of $860 million to $870 million came in above the roughly $828 million analysts expected, also according to Proactive Investors.

Perspective helps here. Reddit priced its initial public offering (IPO) at $34 per share and began trading March 21, 2024, according to a company announcement. Even after this year’s slide, the stock trades at several times that debut price.

Related: Reddit may have a search edge social rivals lack

None of that stopped the stock from getting punished in 2026. Shares had dropped 31.2% year to date and 22.2% in the past month alone before the index news hit, according to Schaeffer’s Investment Research.

The disconnect was stark enough that one Reddit insider, director Sarah Farrell, spent $7.5 million buying the dip earlier this year, a bet that the market was mispricing the business.

Reddit is set to join the S&P 500 before trading opens Aug. 18, replacing AvalonBay Communities.

Ole_CNX / Getty Images

What S&P 500 inclusion means for Reddit stock

Reddit will be added to the benchmark before trading begins on Aug. 18 as part of an off-cycle change, replacing AvalonBay Communities (AVB), which is being acquired by fellow index member Equity Residential (EQR), according to Bloomberg.

Investors did not wait for the paperwork. Shares jumped 11% in extended trading Thursday, Aug. 13, according to CNBC, and pushed higher again on Aug. 14, trading above $170 after a $153.45 close the session before.

More Tech Stocks:

The mechanics behind the pop are simple. Funds that track the S&P 500 have no choice but to buy every stock in it, and those funds may need to absorb an estimated 16.7 million Reddit shares, according to estimates cited by Yahoo Finance. That is why companies often rally the moment inclusion is announced, well before a single index fund places an order. 

Short sellers add fuel to that fire. Bearish bets against Reddit covered 13.24% of the stock’s available float before the announcement, according to Schaeffer’s Investment Research, and forced buying tends to squeeze those positions hard.

Reddit becomes only the second pure-play social media company in the index, joining Meta Platforms (META), and the inclusion recognizes “the growth, momentum, and consistency we’ve established as a public company,” Chief Financial Officer Drew Vollero said, according to a company statement.

The social media wing of the index used to be bigger. Twitter held a spot until Elon Musk took the company private in 2022, and Pinterest (PINS) and Snap (SNAP) both went public years before Reddit but remain smaller by market value, according to CNBC.

There is precedent for what usually comes next. 

Why your retirement account now owns Reddit

Here is the part that reaches beyond traders. If you own an S&P 500 index fund in a 401(k), an individual retirement account (IRA), or a brokerage account, you become a Reddit shareholder on Aug. 18 whether you choose to or not. The forum that taught millions of people to rage against Wall Street is now a line item in the most widely held investment product in America.

Keep the scale in perspective, though. Reddit’s market value sits near $33 billion after the pop, a sliver of an index whose members are collectively worth more than $60 trillion. Your fund’s stake will be measured in fractions of a percent, so this is a milestone for Reddit far more than a makeover for your portfolio.

That does not make the stock a safe bet. The problem that crushed shares in July has not gone anywhere. Reddit told investors its search referrals “were choppy,” and CEO Steve Huffman pointed to Google pushing its Gemini-powered AI Overviews as the culprit, according to CNBC. A company that depends on a rival’s search engine for new users carries real risk, index badge or not.

My analysis is that the inclusion changes who owns Reddit more than it changes what Reddit is worth. The business case rests on the same two engines it did last week, a fast-growing advertising operation and a library of more than 26 billion posts and comments that AI companies want to license, according to the company statement.

The index committee just told the market those engines are durable enough to sit alongside Apple (AAPL) and Microsoft (MSFT). Starting Aug. 18, your retirement account gets to find out if it was right.

Related: Google traffic wobble sends major signal for sinking Reddit stock